Normalized Probabilities Case 3, Sub-analysis 1: 2006 - 2009 Rivals 250 Lists as Population Source, Scaling Competition by Conference
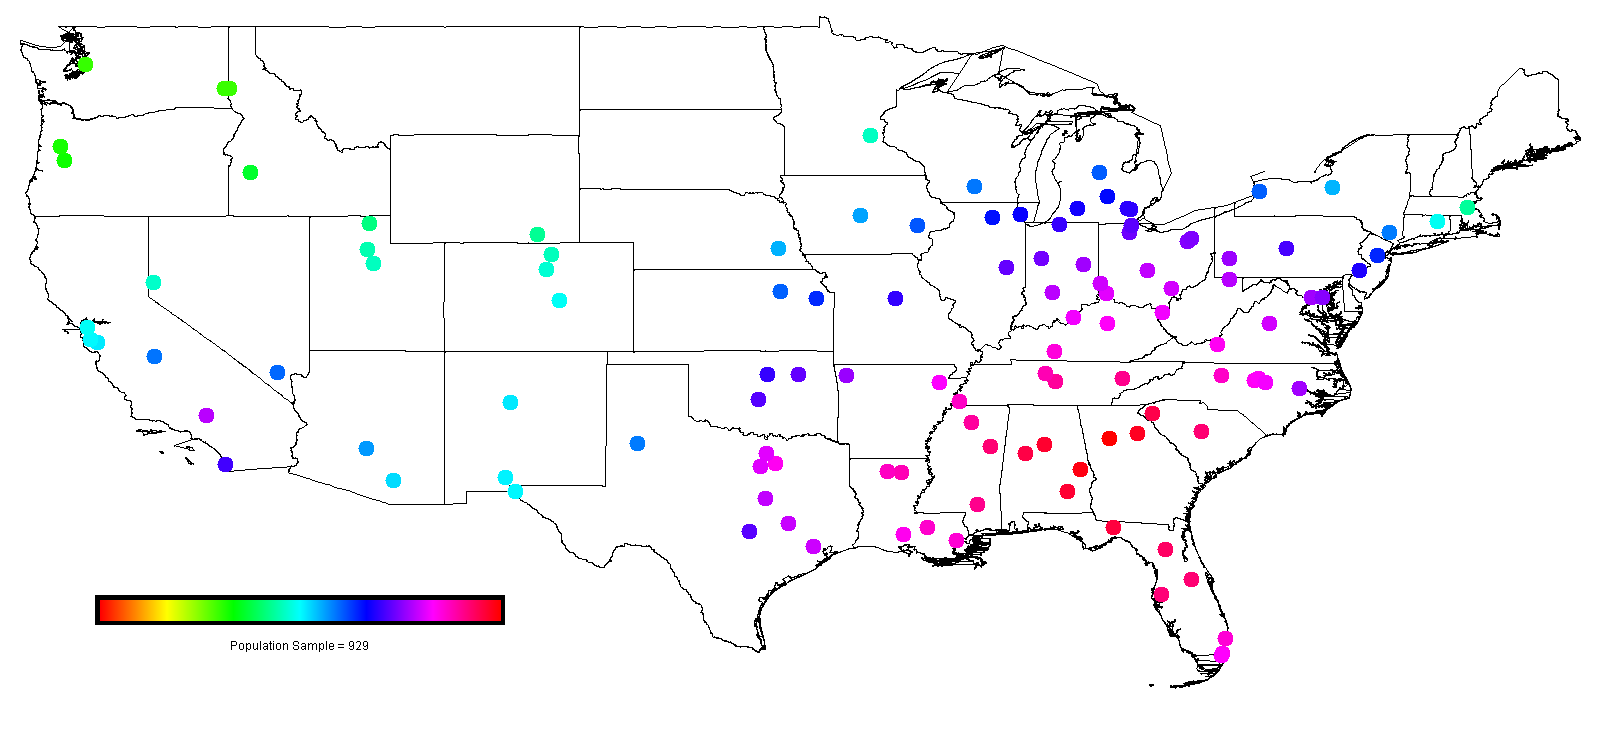
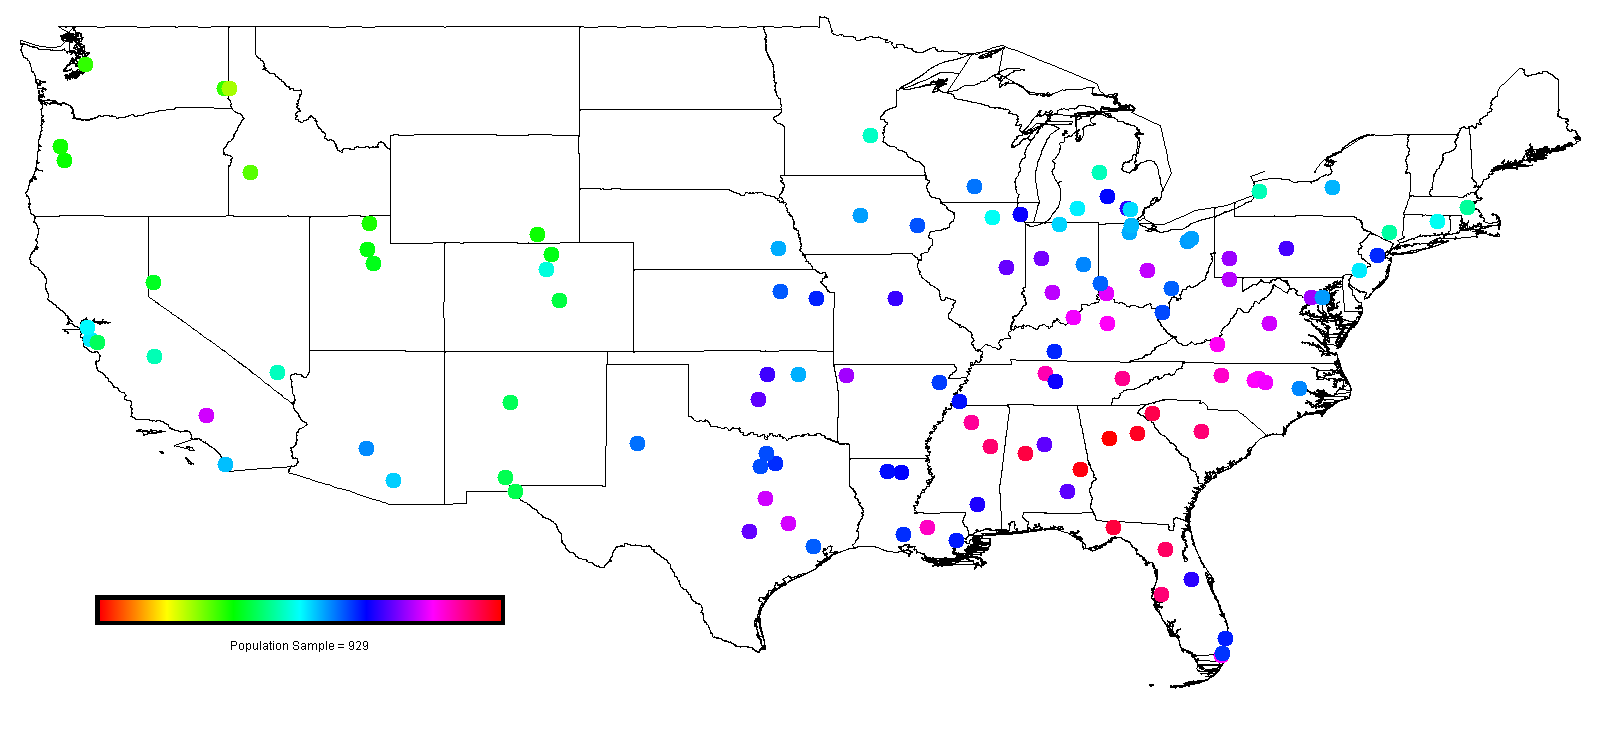
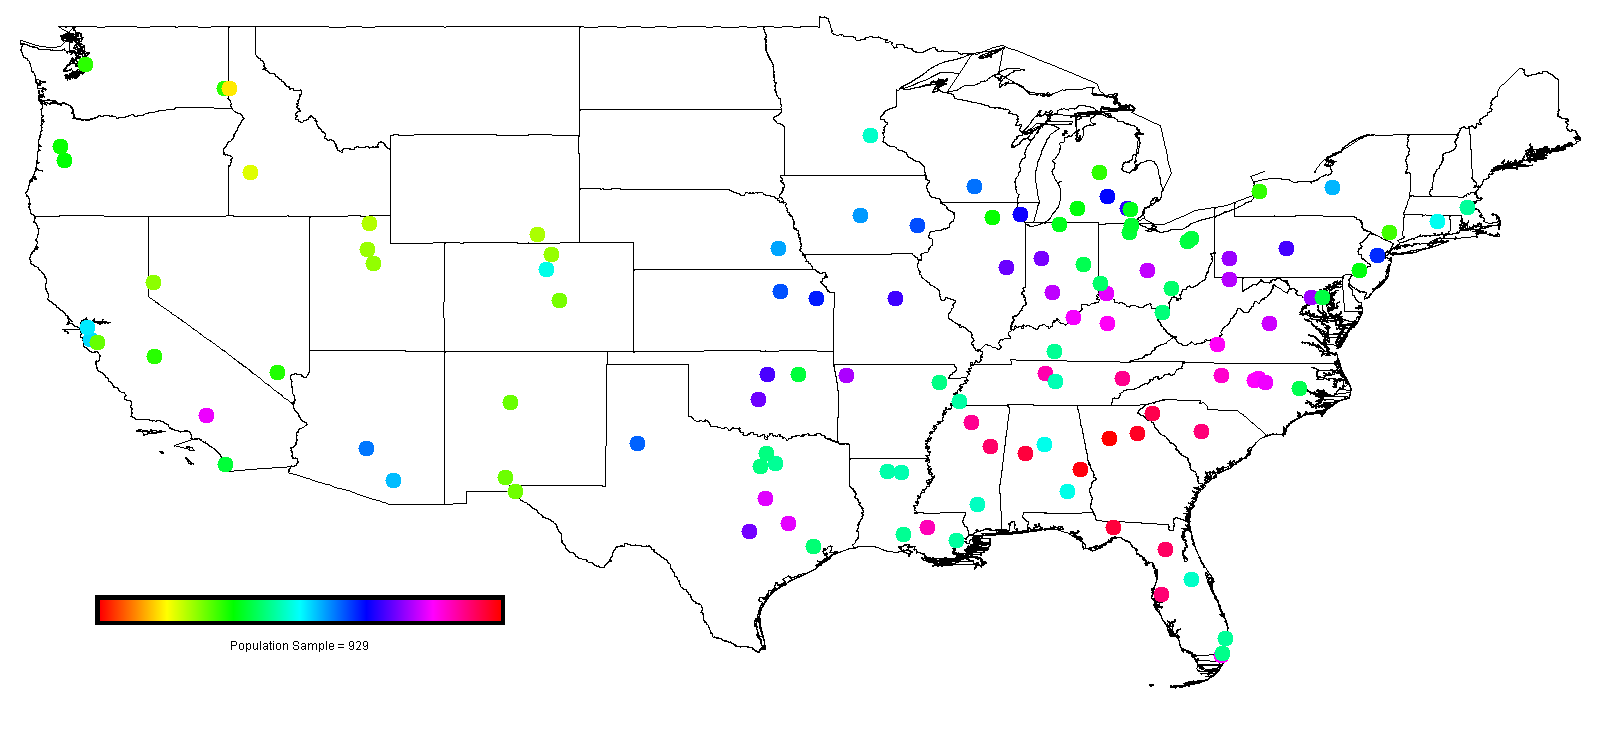
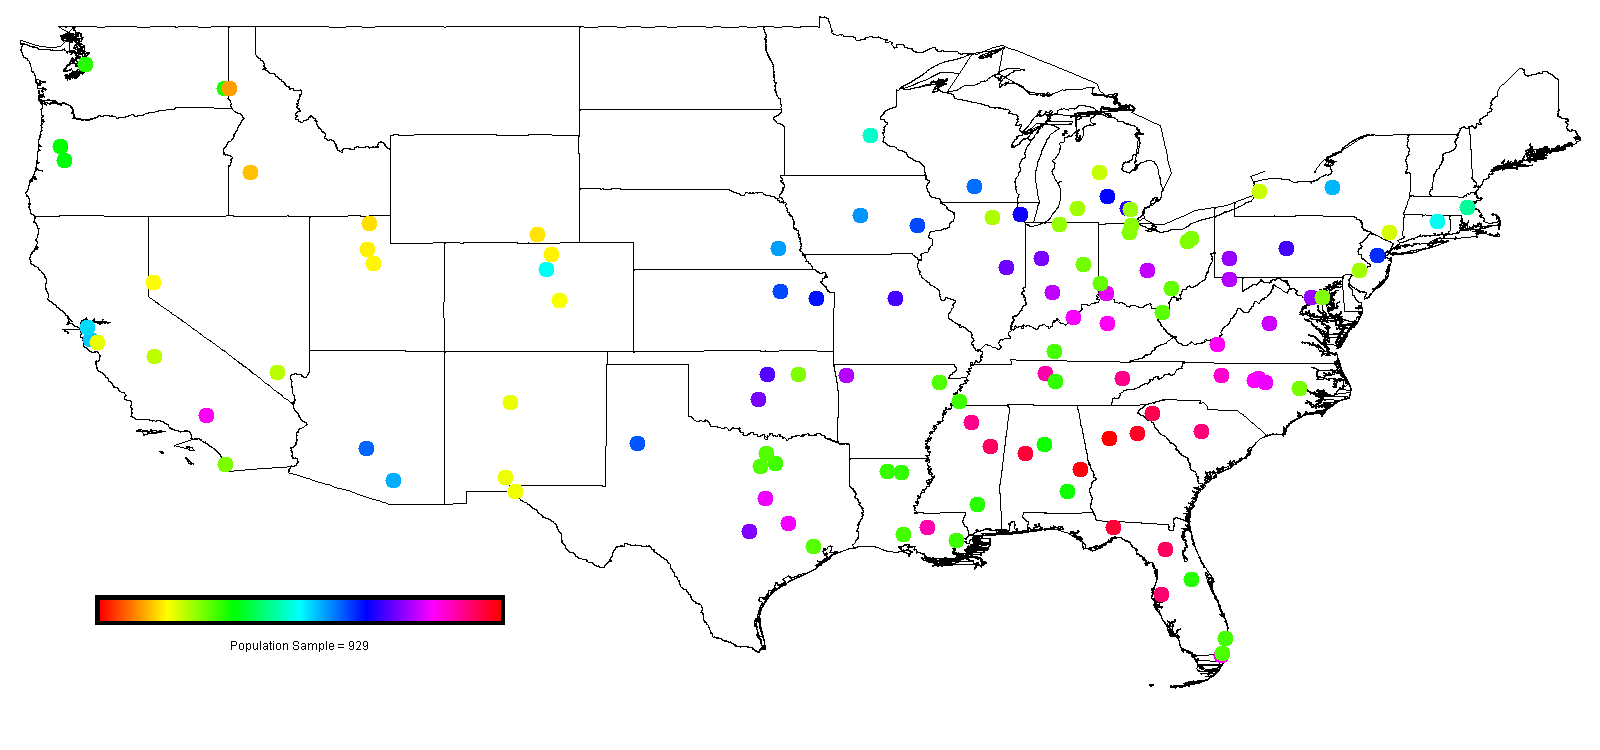
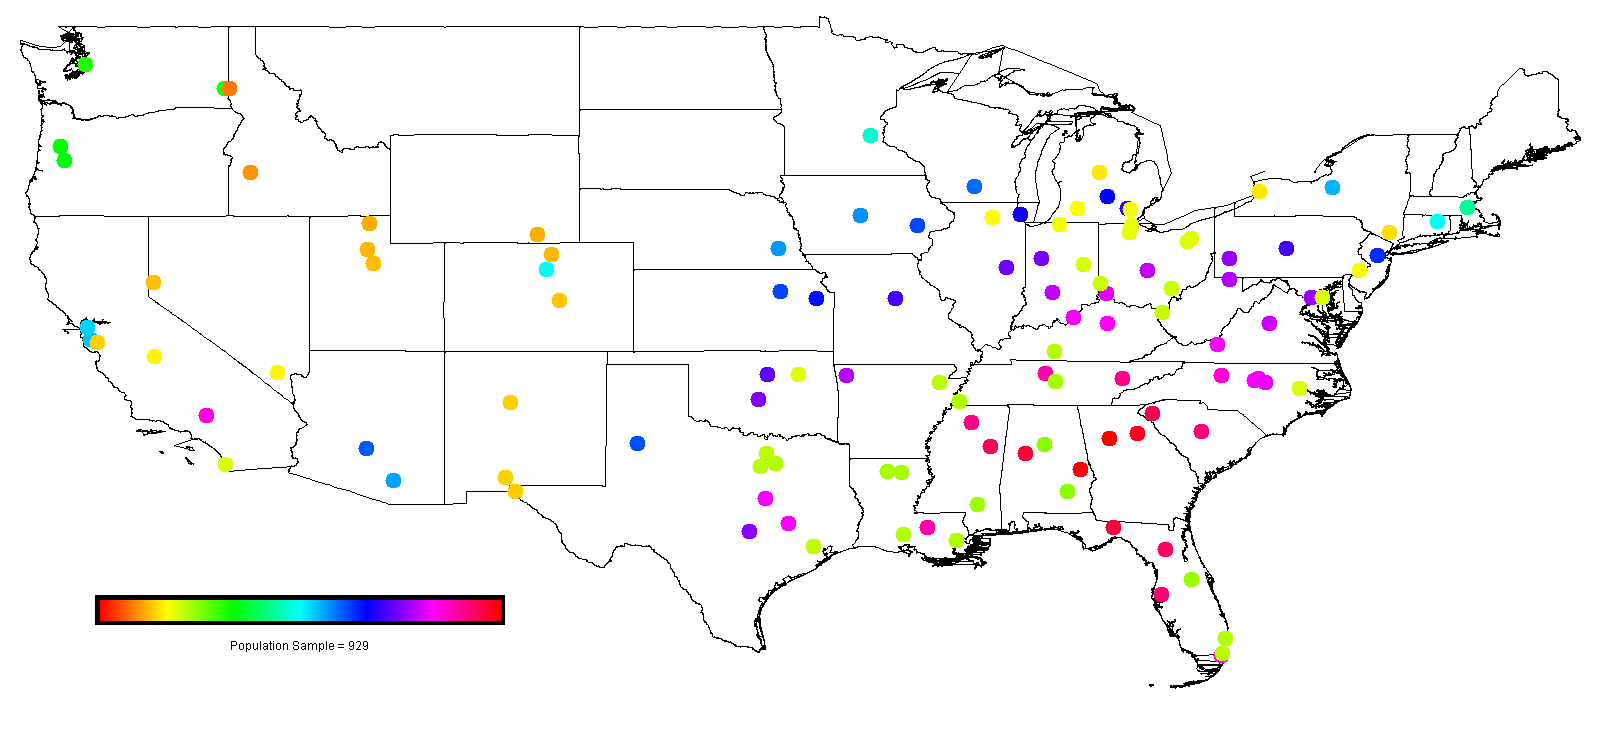
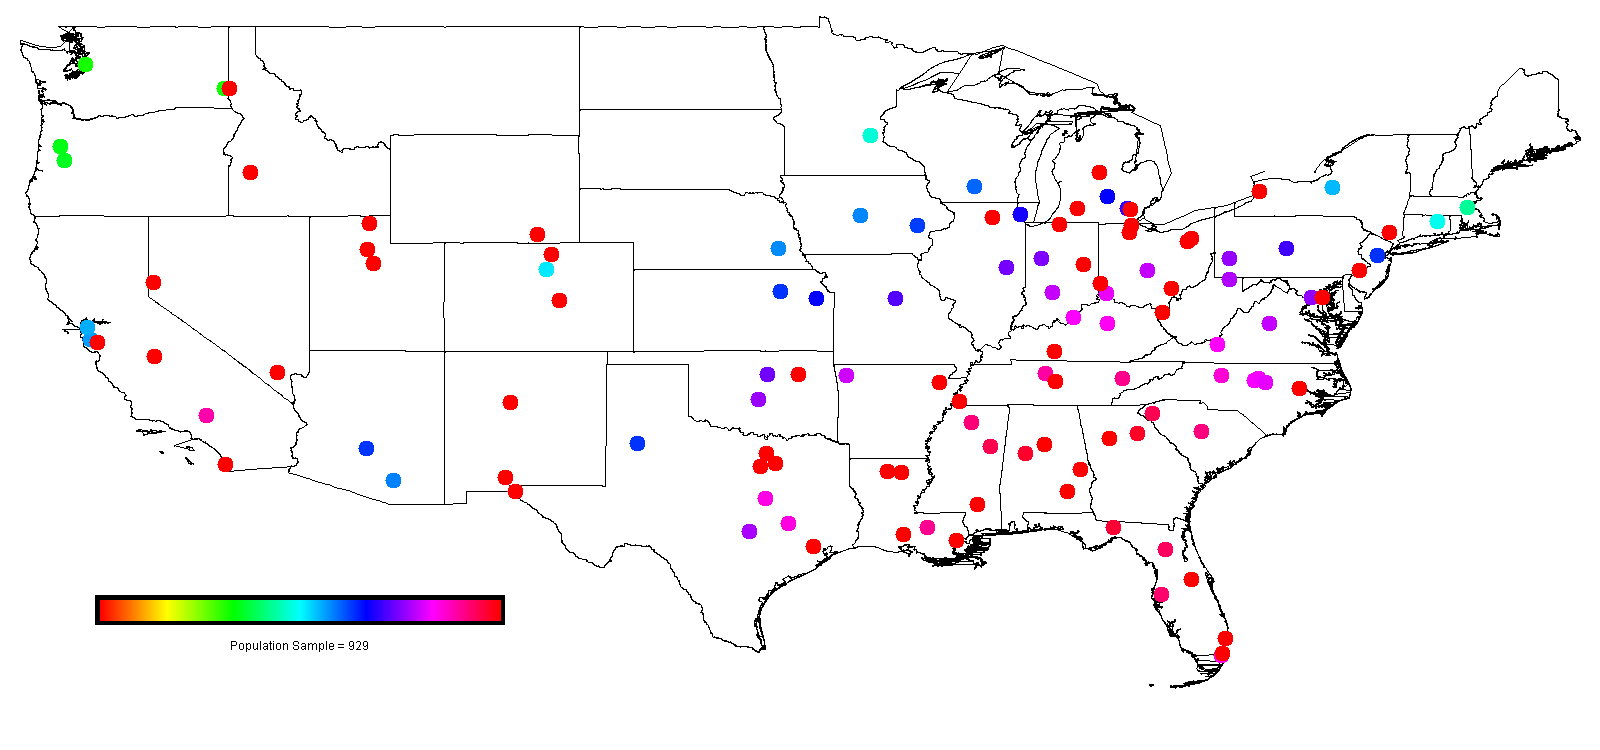
Just as in the "normal" Case 3-1, this study scales schools by their conference affiliation. Given that it follows the normalized probability model, the results are somewhat different than the effective population Case 3-1. As discussed in the methods section, the maps are not very interesting, it is the tables rather that have the real interesting data hence they are shown immediately below with the maps below them.
The population source--the Rivals 250 lists--makes this particularly interesting because we know where these recruits actually chose to enroll and we can assume that every program wanted them. Therefore the numbers calculated--which represent how many of these Rivals 250 recruits a given school should have attracted given the only two criteria are geography and conference affiliation--can be compared to what actually happened.
It's important to first compare the results to those from the effective population version of this case. For the most part, the results are not significantly changed for teams in the Big 6 conferences. The normalized probability method takes into account the competition from other schools in a similar fashion (but not exactly, hence there are subtle differences). For the non-AQ schools, however, the results are quite different as their recruiting influence is scaled down. That is because the effective populations method quantifies how good of a recruiting location they could have whereas this method actually quantifies how many recruits they are liable to attract. So when their recruiting influence is scaled down to zero, this probability model suggests they will get zero recruits (with the exception of Notre Dame, this is pretty much true for Rivals 250 recruits).
Now let's look at the results. As mentioned, non-Notre Dame schools do not attract many of the top-notch recruits. For this reason it's best to isolate the Big 6 teams and see how they fare in the model when non-Big 6 teams are scaled down to zero versus how they fared in the real world. The most obvious underperformer is Georgia Tech which ranks as the easiest place to recruit in this model but somehowe finished behind 33 other teams in attracting top recruits. They did do okay, however, and in terms of net recruits where they are only the 14th biggest underperformer. It's easy to characterize the overperformers. The top 5 reads like the top 5 teams of the decade in terms of on-field performance: USC, Florida, Texas, LSU, Ohio State. These top few teams exceed their expected number of recruits by huge margins and as a result there are more underachievers than overachievers.
It's interesting to compare the over/underperformer lists (Table I) to see where the model goes wrong--or what other variables should improve it. Things that may cause you to underperform in recruiting:
- Being a private school in the south (Vandy, Wake, Baylor, Duke)
- Being a "basketball school" (Duke, Indiana, Kentucky, Louisville, Kansas)
- Being overshadowed by another state school (Texas Tech, South Florida, Cincinnati, Iowa State)
- Having someone not consider Notre Dame a Big 6 school (Indiana, Purdue) -- I'll have to repeat this with Notre Dame considered as a Big 6 team
On the flip side, what helps recruiting? Winning recently and having won in the past. The Top 12 overperformers fit that bill pretty well. In sum, recent winning percentage and total number of wins in team history may be two important scaling factors to add in (the bottom right of Table II actually shows a calculated error for this analysis).
Now let's look more at the actual numbers and what they say about recruiting in the country as a whole (Table IV). The top schools are basically in the heart of the SEC--Florida west to Mississippi (Ole Miss and Mississippi State are notable underachievers in recruiting). It's more interesting to see how far down the list some prominent programs are (note that this list really only goes to 65, the number of Big 6 teams). Even Texas only finishes a pedestrian 33rd when non-Big 6 schools are not considered (scale factor = 0). UT fans will at least be happy to note they are one spot ahead of Oklahoma. Nebraska, one of the two dominent teams of the 1990's, is a mere 54th out of 65. I'm a bit surprised the west didn't catch up more in this analysis as I expected it to correct for low population density states. Again the Oregon/Washington foursome bring up the bottom of the list. I hope the Oregon schools are paying their coaches well.
A note about the images. The circles indicate the number of recruits and location of the 120 schools. They're pretty straightforward except for when non-AQ schools are scaled to zero, then the images don't distinguish "good red" from "bad red". Keeping in mind that the top schools are all in the southeast should help you make sense of it, however.
Table I - Under and Overperformers
| Overperformers | Underperformers | About As Expected | |||||||||||||||
| Rank | College | Expected | Actual | Difference | Rank | College | Expected | Actual | Difference | College | Expected | Actual | Difference | ||||
| 1 | USC | 17.19 | 53.01 | 35.82 | 1 | Vanderbilt | 17.28 | 0.00 | -17.28 | California | 10.70 | 14.88 | 4.18 | ||||
| 2 | Florida | 18.15 | 52.08 | 33.93 | 2 | Wake Forest | 16.65 | 0.00 | -16.65 | Auburn | 19.25 | 23.25 | 4.00 | ||||
| 3 | Texas | 15.03 | 48.36 | 33.33 | 3 | Indiana | 15.40 | 0.00 | -15.40 | Tennessee | 17.57 | 20.46 | 2.89 | ||||
| 4 | LSU | 17.50 | 45.57 | 28.07 | 4 | South Florida | 17.97 | 2.79 | -15.18 | South Carolina | 17.74 | 17.67 | -0.07 | ||||
| 5 | Ohio State | 15.37 | 39.99 | 24.62 | 5 | Cincinnati | 15.84 | 0.93 | -14.91 | Illinois | 14.38 | 13.02 | -1.36 | ||||
| 6 | Michigan | 13.54 | 38.13 | 24.59 | 6 | Baylor | 16.44 | 1.86 | -14.58 | Boston College | 8.36 | 6.51 | -1.85 | ||||
| 7 | Georgia | 18.86 | 39.99 | 21.13 | 7 | Purdue | 14.51 | 0.00 | -14.51 | Arizona | 11.27 | 9.30 | -1.97 | ||||
| 8 | Alabama | 18.78 | 39.06 | 20.28 | 8 | Kentucky | 16.25 | 1.86 | -14.39 | Arizona State | 12.23 | 10.23 | -2.01 | ||||
| 9 | Oklahoma | 14.84 | 32.55 | 17.71 | 9 | Louisville | 16.07 | 2.79 | -13.28 | Oklahoma State | 14.34 | 11.16 | -3.18 | ||||
| 10 | Miami | 16.38 | 33.48 | 17.10 | 10 | Duke | 15.96 | 2.79 | -13.17 | Nebraska | 11.13 | 7.44 | -3.70 | ||||
| 11 | Florida State | 18.66 | 35.34 | 16.67 | 11 | Northwestern | 13.18 | 0.93 | -12.25 | Oregon State | 6.71 | 2.79 | -3.92 | ||||
| 12 | Penn State | 13.68 | 25.11 | 11.43 | 12 | NC State | 15.79 | 3.72 | -12.07 | Stanford | 10.92 | 6.51 | -4.41 | ||||
| 13 | UCLA | 17.19 | 27.90 | 10.71 | 13 | Kansas | 12.94 | 0.93 | -12.01 | Virginia Tech | 16.13 | 11.16 | -4.97 | ||||
| 14 | Clemson | 18.30 | 26.04 | 7.73 | 14 | Georgia Tech | 19.34 | 7.44 | -11.90 | ||||||||
| 15 | Oregon | 6.86 | 12.09 | 5.23 | 15 | Missouri | 13.96 | 2.79 | -11.17 | ||||||||
| 16 | Syracuse | 10.56 | 0.00 | -10.56 | |||||||||||||
| 17 | West Virginia | 15.12 | 4.65 | -10.47 | |||||||||||||
| 18 | Kansas State | 12.25 | 1.86 | -10.39 | |||||||||||||
| 19 | Iowa State | 11.20 | 0.93 | -10.27 | |||||||||||||
| 20 | Connecticut | 9.45 | 0.00 | -9.45 | |||||||||||||
| 21 | Texas Tech | 12.25 | 3.72 | -8.53 | |||||||||||||
| 22 | Ole Miss | 17.82 | 9.30 | -8.52 | |||||||||||||
| 23 | Mississippi State | 18.32 | 10.23 | -8.09 | |||||||||||||
Table II - Actual vs. Modeled Number of Recruits, Teams Sorted Alphabetically
| College | 1.000 | 0.750 | 0.500 | 0.250 | 0.000 | Actual | College | 1.000 | 0.750 | 0.500 | 0.250 | 0.000 | Actual | College | 1.000 | 0.750 | 0.500 | 0.250 | 0.000 | Actual | ||
| Air Force | 5.41 | 4.61 | 3.56 | 2.11 | 0.00 | 0.00 | Kansas | 7.01 | 7.91 | 9.08 | 10.67 | 12.94 | 0.93 | Purdue | 8.12 | 9.12 | 10.40 | 12.11 | 14.51 | 0.00 | ||
| Akron | 8.24 | 6.93 | 5.26 | 3.05 | 0.00 | 0.00 | Kansas State | 6.61 | 7.46 | 8.57 | 10.08 | 12.25 | 1.86 | Rice | 8.75 | 7.44 | 5.72 | 3.38 | 0.00 | 0.00 | ||
| Alabama | 10.45 | 11.74 | 13.41 | 15.64 | 18.78 | 39.06 | Kent State | 8.20 | 6.89 | 5.23 | 3.04 | 0.00 | 0.00 | Rutgers | 7.02 | 7.86 | 8.92 | 10.33 | 12.27 | 6.51 | ||
| Arizona | 5.73 | 6.53 | 7.59 | 9.06 | 11.27 | 9.30 | Kentucky | 9.16 | 10.28 | 11.71 | 13.61 | 16.25 | 1.86 | San Diego State | 7.76 | 6.65 | 5.17 | 3.10 | 0.00 | 0.00 | ||
| Arizona State | 6.20 | 7.07 | 8.22 | 9.83 | 12.23 | 10.23 | Louisiana Tech | 9.56 | 8.09 | 6.20 | 3.64 | 0.00 | 0.00 | San Jose State | 5.62 | 4.81 | 3.73 | 2.23 | 0.00 | 0.00 | ||
| Arkansas | 8.39 | 9.47 | 10.87 | 12.77 | 15.50 | 9.30 | Louisiana-Lafayette | 9.24 | 7.82 | 5.99 | 3.52 | 0.00 | 0.00 | SMU | 9.22 | 7.83 | 6.02 | 3.56 | 0.00 | 0.00 | ||
| Arkansas State | 9.10 | 7.69 | 5.87 | 3.43 | 0.00 | 0.00 | Louisiana-Monroe | 9.65 | 8.17 | 6.26 | 3.67 | 0.00 | 0.00 | South Carolina | 10.13 | 11.34 | 12.88 | 14.91 | 17.74 | 17.67 | ||
| Army | 6.41 | 5.38 | 4.07 | 2.36 | 0.00 | 0.00 | Louisville | 9.03 | 10.13 | 11.55 | 13.43 | 16.07 | 2.79 | South Florida | 10.09 | 11.33 | 12.92 | 15.02 | 17.97 | 2.79 | ||
| Auburn | 10.81 | 12.14 | 13.83 | 16.09 | 19.25 | 23.25 | LSU | 9.49 | 10.71 | 12.29 | 14.43 | 17.50 | 45.57 | Southern Miss | 9.94 | 8.40 | 6.41 | 3.75 | 0.00 | 0.93 | ||
| Ball State | 8.44 | 7.10 | 5.40 | 3.14 | 0.00 | 0.00 | Marshall | 9.04 | 7.59 | 5.76 | 3.34 | 0.00 | 0.00 | Stanford | 5.52 | 6.29 | 7.32 | 8.76 | 10.92 | 6.51 | ||
| Baylor | 8.68 | 9.84 | 11.35 | 13.42 | 16.44 | 1.86 | Maryland | 8.44 | 9.45 | 10.72 | 12.40 | 14.72 | 9.30 | Syracuse | 6.01 | 6.73 | 7.65 | 8.87 | 10.56 | 0.00 | ||
| Boise State | 3.96 | 3.38 | 2.62 | 1.56 | 0.00 | 0.00 | Memphis | 9.54 | 8.05 | 6.14 | 3.59 | 0.00 | 0.00 | TCU | 8.90 | 7.56 | 5.82 | 3.44 | 0.00 | 1.86 | ||
| Boston College | 4.76 | 5.33 | 6.06 | 7.02 | 8.36 | 6.51 | Miami | 9.14 | 10.27 | 11.72 | 13.66 | 16.38 | 33.48 | Temple | 7.50 | 6.30 | 4.77 | 2.76 | 0.00 | 0.00 | ||
| Bowling Green | 8.08 | 6.80 | 5.16 | 3.00 | 0.00 | 0.00 | Miami (OH) | 8.78 | 7.39 | 5.61 | 3.26 | 0.00 | 0.00 | Tennessee | 9.95 | 11.15 | 12.69 | 14.73 | 17.57 | 20.46 | ||
| Buffalo | 6.61 | 5.56 | 4.22 | 2.45 | 0.00 | 0.00 | Michigan | 7.61 | 8.54 | 9.73 | 11.32 | 13.54 | 38.13 | Texas | 7.93 | 8.98 | 10.37 | 12.26 | 15.03 | 48.36 | ||
| BYU | 5.01 | 4.29 | 3.32 | 1.99 | 0.00 | 0.93 | Michigan State | 7.25 | 8.14 | 9.28 | 10.79 | 12.91 | 6.51 | Texas A&M | 8.72 | 9.88 | 11.40 | 13.48 | 16.50 | 9.30 | ||
| California | 5.41 | 6.17 | 7.18 | 8.59 | 10.70 | 14.88 | Middle Tennessee | 9.84 | 8.29 | 6.30 | 3.67 | 0.00 | 0.00 | Texas Tech | 6.42 | 7.28 | 8.41 | 9.97 | 12.25 | 3.72 | ||
| Central Michigan | 6.64 | 5.59 | 4.25 | 2.47 | 0.00 | 0.00 | Minnesota | 5.03 | 5.67 | 6.49 | 7.59 | 9.16 | 3.72 | Toledo | 7.95 | 6.69 | 5.08 | 2.95 | 0.00 | 0.00 | ||
| Cincinnati | 8.92 | 10.01 | 11.40 | 13.25 | 15.84 | 0.93 | Mississippi State | 10.12 | 11.39 | 13.02 | 15.22 | 18.32 | 10.23 | Troy | 10.58 | 8.91 | 6.78 | 3.94 | 0.00 | 0.00 | ||
| Clemson | 10.41 | 11.66 | 13.26 | 15.37 | 18.30 | 26.04 | Missouri | 7.65 | 8.62 | 9.87 | 11.56 | 13.96 | 2.79 | Tulane | 9.43 | 7.98 | 6.10 | 3.57 | 0.00 | 0.00 | ||
| Colorado | 5.16 | 5.86 | 6.79 | 8.06 | 9.95 | 10.23 | Navy | 8.26 | 6.93 | 5.25 | 3.04 | 0.00 | 0.00 | Tulsa | 8.00 | 6.78 | 5.20 | 3.06 | 0.00 | 0.93 | ||
| Colorado State | 5.00 | 4.25 | 3.28 | 1.95 | 0.00 | 0.00 | NC State | 9.05 | 10.12 | 11.49 | 13.30 | 15.79 | 3.72 | UAB | 10.61 | 8.94 | 6.80 | 3.96 | 0.00 | 0.00 | ||
| Connecticut | 5.39 | 6.03 | 6.86 | 7.94 | 9.45 | 0.00 | Nebraska | 6.02 | 6.79 | 7.80 | 9.17 | 11.13 | 7.44 | UCF | 10.12 | 8.52 | 6.47 | 3.76 | 0.00 | 0.93 | ||
| Duke | 9.14 | 10.23 | 11.62 | 13.44 | 15.96 | 2.79 | Nevada | 5.09 | 4.35 | 3.38 | 2.02 | 0.00 | 0.00 | UCLA | 8.62 | 9.85 | 11.48 | 13.76 | 17.19 | 27.90 | ||
| Eastern Michigan | 7.64 | 6.43 | 4.88 | 2.84 | 0.00 | 0.00 | New Mexico | 5.63 | 4.80 | 3.71 | 2.21 | 0.00 | 0.00 | UNLV | 6.56 | 5.62 | 4.36 | 2.61 | 0.00 | 0.00 | ||
| ECU | 8.46 | 7.10 | 5.37 | 3.11 | 0.00 | 0.00 | New Mexico State | 5.56 | 4.74 | 3.67 | 2.18 | 0.00 | 0.00 | USC | 8.62 | 9.85 | 11.48 | 13.76 | 17.19 | 53.01 | ||
| FIU | 9.21 | 7.76 | 5.91 | 3.44 | 0.00 | 0.93 | North Carolina | 9.20 | 10.29 | 11.68 | 13.52 | 16.06 | 16.74 | Utah | 4.90 | 4.19 | 3.25 | 1.95 | 0.00 | 0.93 | ||
| Florida | 10.24 | 11.48 | 13.08 | 15.19 | 18.15 | 52.08 | North Texas | 8.91 | 7.57 | 5.82 | 3.44 | 0.00 | 0.00 | Utah State | 4.56 | 3.90 | 3.02 | 1.80 | 0.00 | 0.00 | ||
| Florida Atlantic | 9.42 | 7.94 | 6.04 | 3.52 | 0.00 | 0.00 | Northern Illinois | 7.18 | 6.05 | 4.61 | 2.69 | 0.00 | 0.00 | UTEP | 5.52 | 4.71 | 3.64 | 2.16 | 0.00 | 0.00 | ||
| Florida State | 10.50 | 11.78 | 13.43 | 15.61 | 18.66 | 35.34 | Northwestern | 7.36 | 8.26 | 9.43 | 10.99 | 13.18 | 0.93 | Vanderbilt | 9.67 | 10.85 | 12.38 | 14.42 | 17.28 | 0.00 | ||
| Fresno State | 6.47 | 5.54 | 4.30 | 2.58 | 0.00 | 0.00 | Notre Dame | 7.69 | 6.47 | 4.92 | 2.87 | 0.00 | 39.99 | Virginia | 8.80 | 9.85 | 11.18 | 12.94 | 15.37 | 7.44 | ||
| Georgia | 10.71 | 12.00 | 13.64 | 15.82 | 18.86 | 39.99 | Ohio | 8.81 | 7.40 | 5.62 | 3.26 | 0.00 | 0.00 | Virginia Tech | 9.21 | 10.31 | 11.71 | 13.56 | 16.13 | 11.16 | ||
| Georgia Tech | 10.94 | 12.27 | 13.96 | 16.21 | 19.34 | 7.44 | Ohio State | 8.68 | 9.73 | 11.08 | 12.87 | 15.37 | 39.99 | Wake Forest | 9.52 | 10.65 | 12.10 | 14.01 | 16.65 | 0.00 | ||
| Hawaii | 1.84 | 1.58 | 1.23 | 0.75 | 0.00 | 0.00 | Oklahoma | 7.90 | 8.94 | 10.30 | 12.15 | 14.84 | 32.55 | Washington | 3.26 | 3.70 | 4.27 | 5.04 | 6.18 | 6.51 | ||
| Houston | 8.75 | 7.44 | 5.72 | 3.38 | 0.00 | 0.00 | Oklahoma State | 7.67 | 8.67 | 9.98 | 11.76 | 14.34 | 11.16 | Washington State | 3.25 | 3.69 | 4.27 | 5.07 | 6.26 | 0.00 | ||
| Idaho | 3.24 | 2.76 | 2.13 | 1.27 | 0.00 | 0.00 | Ole Miss | 9.82 | 11.06 | 12.65 | 14.79 | 17.82 | 9.30 | West Virginia | 8.61 | 9.64 | 10.96 | 12.70 | 15.12 | 4.65 | ||
| Illinois | 8.01 | 9.00 | 10.28 | 11.98 | 14.38 | 13.02 | Oregon | 3.55 | 4.03 | 4.67 | 5.55 | 6.86 | 12.09 | Western Kentucky | 9.37 | 7.89 | 6.00 | 3.49 | 0.00 | 0.00 | ||
| Indiana | 8.62 | 9.68 | 11.04 | 12.86 | 15.40 | 0.00 | Oregon State | 3.49 | 3.96 | 4.58 | 5.44 | 6.71 | 2.79 | Western Michigan | 7.43 | 6.25 | 4.75 | 2.77 | 0.00 | 0.93 | ||
| Iowa | 6.68 | 7.52 | 8.60 | 10.06 | 12.12 | 6.51 | Penn State | 7.81 | 8.74 | 9.93 | 11.50 | 13.68 | 25.11 | Wisconsin | 6.45 | 7.25 | 8.28 | 9.66 | 11.61 | 6.51 | ||
| Iowa State | 6.13 | 6.91 | 7.91 | 9.27 | 11.20 | 0.93 | Pittsburgh | 8.40 | 9.41 | 10.70 | 12.41 | 14.78 | 14.88 | Wyoming | 4.70 | 4.01 | 3.09 | 1.84 | 0.00 | 0.00 | ||
| Total Deviation from Actual | 1077.32 | 1012.17 | 937.76 | 844.26 | 742.97 | |||||||||||||||||
Table III - Recruiting Ranking, Actual vs. Modeled, Teams Sorted Alphabetically
| College | 1.000 | 0.750 | 0.500 | 0.250 | 0.000 | Actual | College | 1.000 | 0.750 | 0.500 | 0.250 | 0.000 | Actual | College | 1.000 | 0.750 | 0.500 | 0.250 | 0.000 | Actual | ||
| Air Force | 102 | 107 | 111 | 111 | 66 | 68 | Kansas | 82 | 55 | 45 | 45 | 44 | 61 | Purdue | 62 | 35 | 35 | 37 | 37 | 68 | ||
| Akron | 60 | 77 | 86 | 92 | 66 | 68 | Kansas State | 86 | 66 | 48 | 47 | 47 | 54 | Rice | 46 | 68 | 81 | 84 | 66 | 68 | ||
| Alabama | 7 | 5 | 5 | 4 | 4 | 8 | Kent State | 61 | 79 | 88 | 93 | 66 | 68 | Rutgers | 81 | 57 | 46 | 46 | 46 | 40 | ||
| Arizona | 96 | 86 | 55 | 54 | 52 | 29 | Kentucky | 32 | 18 | 18 | 19 | 21 | 55 | San Diego State | 70 | 85 | 90 | 90 | 66 | 68 | ||
| Arizona State | 92 | 75 | 51 | 50 | 49 | 26 | Louisiana Tech | 20 | 51 | 67 | 72 | 66 | 68 | San Jose State | 98 | 103 | 107 | 107 | 66 | 68 | ||
| Arkansas | 58 | 32 | 32 | 31 | 28 | 30 | Louisiana-Lafayette | 27 | 59 | 74 | 76 | 66 | 68 | SMU | 28 | 58 | 72 | 75 | 66 | 68 | ||
| Arkansas State | 35 | 61 | 76 | 82 | 66 | 68 | Louisiana-Monroe | 19 | 49 | 66 | 70 | 66 | 68 | South Carolina | 10 | 9 | 10 | 10 | 11 | 18 | ||
| Army | 91 | 101 | 106 | 106 | 66 | 68 | Louisville | 38 | 21 | 21 | 24 | 23 | 49 | South Florida | 13 | 10 | 9 | 9 | 9 | 52 | ||
| Auburn | 2 | 2 | 2 | 2 | 2 | 16 | LSU | 23 | 14 | 14 | 13 | 13 | 4 | Southern Miss | 15 | 46 | 64 | 69 | 66 | 63 | ||
| Ball State | 56 | 73 | 84 | 88 | 66 | 68 | Marshall | 37 | 62 | 79 | 85 | 66 | 68 | Stanford | 101 | 90 | 56 | 56 | 55 | 41 | ||
| Baylor | 48 | 28 | 27 | 25 | 19 | 53 | Maryland | 55 | 33 | 33 | 34 | 36 | 31 | Syracuse | 95 | 83 | 54 | 55 | 57 | 68 | ||
| Boise State | 114 | 118 | 118 | 118 | 66 | 68 | Memphis | 21 | 52 | 68 | 73 | 66 | 68 | TCU | 41 | 64 | 78 | 81 | 66 | 56 | ||
| Boston College | 111 | 102 | 70 | 61 | 61 | 37 | Miami | 34 | 19 | 16 | 18 | 20 | 11 | Temple | 76 | 89 | 95 | 100 | 66 | 68 | ||
| Bowling Green | 63 | 80 | 91 | 95 | 66 | 68 | Miami (OH) | 44 | 70 | 83 | 86 | 66 | 68 | Tennessee | 14 | 11 | 11 | 12 | 12 | 17 | ||
| Buffalo | 85 | 99 | 105 | 105 | 66 | 68 | Michigan | 75 | 44 | 42 | 42 | 42 | 9 | Texas | 67 | 37 | 36 | 35 | 33 | 3 | ||
| BYU | 108 | 109 | 113 | 113 | 66 | 57 | Michigan State | 79 | 50 | 44 | 44 | 45 | 39 | Texas A&M | 47 | 24 | 26 | 22 | 18 | 33 | ||
| California | 103 | 92 | 57 | 57 | 56 | 20 | Middle Tennessee | 16 | 47 | 65 | 71 | 66 | 68 | Texas Tech | 90 | 71 | 49 | 49 | 48 | 47 | ||
| Central Michigan | 84 | 98 | 104 | 104 | 66 | 68 | Minnesota | 107 | 96 | 62 | 60 | 60 | 45 | Toledo | 66 | 84 | 92 | 96 | 66 | 68 | ||
| Cincinnati | 39 | 23 | 25 | 27 | 26 | 58 | Mississippi State | 12 | 8 | 8 | 7 | 6 | 28 | Troy | 5 | 40 | 61 | 67 | 66 | 68 | ||
| Clemson | 8 | 6 | 6 | 6 | 7 | 14 | Missouri | 73 | 43 | 41 | 40 | 40 | 50 | Tulane | 24 | 53 | 69 | 74 | 66 | 68 | ||
| Colorado | 105 | 95 | 60 | 58 | 58 | 27 | Navy | 59 | 76 | 87 | 94 | 66 | 68 | Tulsa | 65 | 82 | 89 | 91 | 66 | 64 | ||
| Colorado State | 109 | 110 | 114 | 114 | 66 | 68 | NC State | 36 | 22 | 22 | 26 | 27 | 46 | UAB | 4 | 39 | 59 | 66 | 66 | 68 | ||
| Connecticut | 104 | 94 | 58 | 59 | 59 | 68 | Nebraska | 94 | 81 | 53 | 53 | 54 | 35 | UCF | 11 | 45 | 63 | 68 | 66 | 65 | ||
| Duke | 33 | 20 | 20 | 23 | 25 | 48 | Nevada | 106 | 108 | 112 | 112 | 66 | 68 | UCLA | 51 | 26 | 23 | 16 | 15 | 13 | ||
| Eastern Michigan | 74 | 88 | 94 | 98 | 66 | 68 | New Mexico | 97 | 104 | 108 | 108 | 66 | 68 | UNLV | 87 | 97 | 100 | 102 | 66 | 68 | ||
| ECU | 54 | 74 | 85 | 89 | 66 | 68 | New Mexico State | 99 | 105 | 109 | 109 | 66 | 68 | USC | 52 | 27 | 24 | 17 | 16 | 1 | ||
| FIU | 29 | 60 | 75 | 79 | 66 | 59 | North Carolina | 31 | 17 | 19 | 21 | 24 | 19 | Utah | 110 | 111 | 115 | 115 | 66 | 66 | ||
| Florida | 9 | 7 | 7 | 8 | 8 | 2 | North Texas | 40 | 63 | 77 | 80 | 66 | 68 | Utah State | 113 | 115 | 117 | 117 | 66 | 68 | ||
| Florida Atlantic | 25 | 54 | 71 | 77 | 66 | 68 | Northern Illinois | 80 | 93 | 98 | 101 | 66 | 68 | UTEP | 100 | 106 | 110 | 110 | 66 | 68 | ||
| Florida State | 6 | 4 | 4 | 5 | 5 | 10 | Northwestern | 78 | 48 | 43 | 43 | 43 | 62 | Vanderbilt | 18 | 13 | 13 | 14 | 14 | 68 | ||
| Fresno State | 88 | 100 | 101 | 103 | 66 | 68 | Notre Dame | 71 | 87 | 93 | 97 | 66 | 6 | Virginia | 43 | 25 | 28 | 28 | 30 | 36 | ||
| Georgia | 3 | 3 | 3 | 3 | 3 | 5 | Ohio | 42 | 69 | 82 | 87 | 66 | 68 | Virginia Tech | 30 | 16 | 17 | 20 | 22 | 25 | ||
| Georgia Tech | 1 | 1 | 1 | 1 | 1 | 34 | Ohio State | 49 | 29 | 29 | 29 | 31 | 7 | Wake Forest | 22 | 15 | 15 | 15 | 17 | 68 | ||
| Hawaii | 120 | 120 | 120 | 120 | 66 | 68 | Oklahoma | 68 | 38 | 37 | 36 | 34 | 12 | Washington | 117 | 116 | 103 | 65 | 65 | 42 | ||
| Houston | 45 | 67 | 80 | 83 | 66 | 68 | Oklahoma State | 72 | 42 | 39 | 39 | 39 | 24 | Washington State | 118 | 117 | 102 | 64 | 64 | 68 | ||
| Idaho | 119 | 119 | 119 | 119 | 66 | 68 | Ole Miss | 17 | 12 | 12 | 11 | 10 | 32 | West Virginia | 53 | 31 | 31 | 32 | 32 | 44 | ||
| Illinois | 64 | 36 | 38 | 38 | 38 | 22 | Oregon | 115 | 112 | 97 | 62 | 62 | 23 | Western Kentucky | 26 | 56 | 73 | 78 | 66 | 68 | ||
| Indiana | 50 | 30 | 30 | 30 | 29 | 68 | Oregon State | 116 | 114 | 99 | 63 | 63 | 51 | Western Michigan | 77 | 91 | 96 | 99 | 66 | 67 | ||
| Iowa | 83 | 65 | 47 | 48 | 50 | 38 | Penn State | 69 | 41 | 40 | 41 | 41 | 15 | Wisconsin | 89 | 72 | 50 | 51 | 51 | 43 | ||
| Iowa State | 93 | 78 | 52 | 52 | 53 | 60 | Pittsburgh | 57 | 34 | 34 | 33 | 35 | 21 | Wyoming | 112 | 113 | 116 | 116 | 66 | 68 |
Table IV - Rankings for Each Scale Factor
| Scale Factor = 1.0 | Scale Factor = 0.75 | Scale Factor = 0.50 | Scale Factor = 0.250 | Scale Factor = 0.0 | ||||||||||||||
| Rank | College | Recruits | Rank | College | Recruits | Rank | College | Recruits | Rank | College | Recruits | Ran k | College | Recruits | ||||
| 1 | Georgia Tech | 10.94 | 1 | Georgia Tech | 12.27 | 1 | Georgia Tech | 13.96 | 1 | Georgia Tech | 16.21 | 1 | Georgia Tech | 19.34 | ||||
| 2 | Auburn | 10.81 | 2 | Auburn | 12.14 | 2 | Auburn | 13.83 | 2 | Auburn | 16.09 | 2 | Auburn | 19.25 | ||||
| 3 | Georgia | 10.71 | 3 | Georgia | 12.00 | 3 | Georgia | 13.64 | 3 | Georgia | 15.82 | 3 | Georgia | 18.86 | ||||
| 4 | UAB | 10.61 | 4 | Florida State | 11.78 | 4 | Florida State | 13.43 | 4 | Alabama | 15.64 | 4 | Alabama | 18.78 | ||||
| 5 | Troy | 10.58 | 5 | Alabama | 11.74 | 5 | Alabama | 13.41 | 5 | Florida State | 15.61 | 5 | Florida State | 18.66 | ||||
| 6 | Florida State | 10.50 | 6 | Clemson | 11.66 | 6 | Clemson | 13.26 | 6 | Clemson | 15.37 | 6 | Mississippi State | 18.32 | ||||
| 7 | Alabama | 10.45 | 7 | Florida | 11.48 | 7 | Florida | 13.08 | 7 | Mississippi State | 15.22 | 7 | Clemson | 18.30 | ||||
| 8 | Clemson | 10.41 | 8 | Mississippi State | 11.39 | 8 | Mississippi State | 13.02 | 8 | Florida | 15.19 | 8 | Florida | 18.15 | ||||
| 9 | Florida | 10.24 | 9 | South Carolina | 11.34 | 9 | South Florida | 12.92 | 9 | South Florida | 15.02 | 9 | South Florida | 17.97 | ||||
| 10 | South Carolina | 10.13 | 10 | South Florida | 11.33 | 10 | South Carolina | 12.88 | 10 | South Carolina | 14.91 | 10 | Ole Miss | 17.82 | ||||
| 11 | UCF | 10.12 | 11 | Tennessee | 11.15 | 11 | Tennessee | 12.69 | 11 | Ole Miss | 14.79 | 11 | South Carolina | 17.74 | ||||
| 12 | Mississippi State | 10.12 | 12 | Ole Miss | 11.06 | 12 | Ole Miss | 12.65 | 12 | Tennessee | 14.73 | 12 | Tennessee | 17.57 | ||||
| 13 | South Florida | 10.09 | 13 | Vanderbilt | 10.85 | 13 | Vanderbilt | 12.38 | 13 | LSU | 14.43 | 13 | LSU | 17.50 | ||||
| 14 | Tennessee | 9.95 | 14 | LSU | 10.71 | 14 | LSU | 12.29 | 14 | Vanderbilt | 14.42 | 14 | Vanderbilt | 17.28 | ||||
| 15 | Southern Miss | 9.94 | 15 | Wake Forest | 10.65 | 15 | Wake Forest | 12.10 | 15 | Wake Forest | 14.01 | 15 | UCLA | 17.19 | ||||
| 16 | Middle Tennessee | 9.84 | 16 | Virginia Tech | 10.31 | 16 | Miami | 11.72 | 16 | UCLA | 13.76 | 16 | USC | 17.19 | ||||
| 17 | Ole Miss | 9.82 | 17 | North Carolina | 10.29 | 17 | Virginia Tech | 11.71 | 17 | USC | 13.76 | 17 | Wake Forest | 16.65 | ||||
| 18 | Vanderbilt | 9.67 | 18 | Kentucky | 10.28 | 18 | Kentucky | 11.71 | 18 | Miami | 13.66 | 18 | Texas A&M | 16.50 | ||||
| 19 | Louisiana-Monroe | 9.65 | 19 | Miami | 10.27 | 19 | North Carolina | 11.68 | 19 | Kentucky | 13.61 | 19 | Baylor | 16.44 | ||||
| 20 | Louisiana Tech | 9.56 | 20 | Duke | 10.23 | 20 | Duke | 11.62 | 20 | Virginia Tech | 13.56 | 20 | Miami | 16.38 | ||||
| 21 | Memphis | 9.54 | 21 | Louisville | 10.13 | 21 | Louisville | 11.55 | 21 | North Carolina | 13.52 | 21 | Kentucky | 16.25 | ||||
| 22 | Wake Forest | 9.52 | 22 | NC State | 10.12 | 22 | NC State | 11.49 | 22 | Texas A&M | 13.48 | 22 | Virginia Tech | 16.13 | ||||
| 23 | LSU | 9.49 | 23 | Cincinnati | 10.01 | 23 | UCLA | 11.48 | 23 | Duke | 13.44 | 23 | Louisville | 16.07 | ||||
| 24 | Tulane | 9.43 | 24 | Texas A&M | 9.88 | 24 | USC | 11.48 | 24 | Louisville | 13.43 | 24 | North Carolina | 16.06 | ||||
| 25 | Florida Atlantic | 9.42 | 25 | Virginia | 9.85 | 25 | Cincinnati | 11.40 | 25 | Baylor | 13.42 | 25 | Duke | 15.96 | ||||
| 26 | Western Kentucky | 9.37 | 26 | UCLA | 9.85 | 26 | Texas A&M | 11.40 | 26 | NC State | 13.30 | 26 | Cincinnati | 15.84 | ||||
| 27 | Louisiana-Lafayette | 9.24 | 27 | USC | 9.85 | 27 | Baylor | 11.35 | 27 | Cincinnati | 13.25 | 27 | NC State | 15.79 | ||||
| 28 | SMU | 9.22 | 28 | Baylor | 9.84 | 28 | Virginia | 11.18 | 28 | Virginia | 12.94 | 28 | Arkansas | 15.50 | ||||
| 29 | FIU | 9.21 | 29 | Ohio State | 9.73 | 29 | Ohio State | 11.08 | 29 | Ohio State | 12.87 | 29 | Indiana | 15.40 | ||||
| 30 | Virginia Tech | 9.21 | 30 | Indiana | 9.68 | 30 | Indiana | 11.04 | 30 | Indiana | 12.86 | 30 | Virginia | 15.37 | ||||
| 31 | North Carolina | 9.20 | 31 | West Virginia | 9.64 | 31 | West Virginia | 10.96 | 31 | Arkansas | 12.77 | 31 | Ohio State | 15.37 | ||||
| 32 | Kentucky | 9.16 | 32 | Arkansas | 9.47 | 32 | Arkansas | 10.87 | 32 | West Virginia | 12.70 | 32 | West Virginia | 15.12 | ||||
| 33 | Duke | 9.14 | 33 | Maryland | 9.45 | 33 | Maryland | 10.72 | 33 | Pittsburgh | 12.41 | 33 | Texas | 15.03 | ||||
| 34 | Miami | 9.14 | 34 | Pittsburgh | 9.41 | 34 | Pittsburgh | 10.70 | 34 | Maryland | 12.40 | 34 | Oklahoma | 14.84 | ||||
| 35 | Arkansas State | 9.10 | 35 | Purdue | 9.12 | 35 | Purdue | 10.40 | 35 | Texas | 12.26 | 35 | Pittsburgh | 14.78 | ||||
| 36 | NC State | 9.05 | 36 | Illinois | 9.00 | 36 | Texas | 10.37 | 36 | Oklahoma | 12.15 | 36 | Maryland | 14.72 | ||||
| 37 | Marshall | 9.04 | 37 | Texas | 8.98 | 37 | Oklahoma | 10.30 | 37 | Purdue | 12.11 | 37 | Purdue | 14.51 | ||||
| 38 | Louisville | 9.03 | 38 | Oklahoma | 8.94 | 38 | Illinois | 10.28 | 38 | Illinois | 11.98 | 38 | Illinois | 14.38 | ||||
| 39 | Cincinnati | 8.92 | 39 | UAB | 8.94 | 39 | Oklahoma State | 9.98 | 39 | Oklahoma State | 11.76 | 39 | Oklahoma State | 14.34 | ||||
| 40 | North Texas | 8.91 | 40 | Troy | 8.91 | 40 | Penn State | 9.93 | 40 | Missouri | 11.56 | 40 | Missouri | 13.96 | ||||
| 41 | TCU | 8.90 | 41 | Penn State | 8.74 | 41 | Missouri | 9.87 | 41 | Penn State | 11.50 | 41 | Penn State | 13.68 | ||||
| 42 | Ohio | 8.81 | 42 | Oklahoma State | 8.67 | 42 | Michigan | 9.73 | 42 | Michigan | 11.32 | 42 | Michigan | 13.54 | ||||
| 43 | Virginia | 8.80 | 43 | Missouri | 8.62 | 43 | Northwestern | 9.43 | 43 | Northwestern | 10.99 | 43 | Northwestern | 13.18 | ||||
| 44 | Miami (OH) | 8.78 | 44 | Michigan | 8.54 | 44 | Michigan State | 9.28 | 44 | Michigan State | 10.79 | 44 | Kansas | 12.94 | ||||
| 45 | Houston | 8.75 | 45 | UCF | 8.52 | 45 | Kansas | 9.08 | 45 | Kansas | 10.67 | 45 | Michigan State | 12.91 | ||||
| 46 | Rice | 8.75 | 46 | Southern Miss | 8.40 | 46 | Rutgers | 8.92 | 46 | Rutgers | 10.33 | 46 | Rutgers | 12.27 | ||||
| 47 | Texas A&M | 8.72 | 47 | Middle Tennessee | 8.29 | 47 | Iowa | 8.60 | 47 | Kansas State | 10.08 | 47 | Kansas State | 12.25 | ||||
| 48 | Baylor | 8.68 | 48 | Northwestern | 8.26 | 48 | Kansas State | 8.57 | 48 | Iowa | 10.06 | 48 | Texas Tech | 12.25 | ||||
| 49 | Ohio State | 8.68 | 49 | Louisiana-Monroe | 8.17 | 49 | Texas Tech | 8.41 | 49 | Texas Tech | 9.97 | 49 | Arizona State | 12.23 | ||||
| 50 | Indiana | 8.62 | 50 | Michigan State | 8.14 | 50 | Wisconsin | 8.28 | 50 | Arizona State | 9.83 | 50 | Iowa | 12.12 | ||||
| 51 | UCLA | 8.62 | 51 | Louisiana Tech | 8.09 | 51 | Arizona State | 8.22 | 51 | Wisconsin | 9.66 | 51 | Wisconsin | 11.61 | ||||
| 52 | USC | 8.62 | 52 | Memphis | 8.05 | 52 | Iowa State | 7.91 | 52 | Iowa State | 9.27 | 52 | Arizona | 11.27 | ||||
| 53 | West Virginia | 8.61 | 53 | Tulane | 7.98 | 53 | Nebraska | 7.80 | 53 | Nebraska | 9.17 | 53 | Iowa State | 11.20 | ||||
| 54 | ECU | 8.46 | 54 | Florida Atlantic | 7.94 | 54 | Syracuse | 7.65 | 54 | Arizona | 9.06 | 54 | Nebraska | 11.13 | ||||
| 55 | Maryland | 8.44 | 55 | Kansas | 7.91 | 55 | Arizona | 7.59 | 55 | Syracuse | 8.87 | 55 | Stanford | 10.92 | ||||
| 56 | Ball State | 8.44 | 56 | Western Kentucky | 7.89 | 56 | Stanford | 7.32 | 56 | Stanford | 8.76 | 56 | California | 10.70 | ||||
| 57 | Pittsburgh | 8.40 | 57 | Rutgers | 7.86 | 57 | California | 7.18 | 57 | California | 8.59 | 57 | Syracuse | 10.56 | ||||
| 58 | Arkansas | 8.39 | 58 | SMU | 7.83 | 58 | Connecticut | 6.86 | 58 | Colorado | 8.06 | 58 | Colorado | 9.95 | ||||
| 59 | Navy | 8.26 | 59 | Louisiana-Lafayette | 7.82 | 59 | UAB | 6.80 | 59 | Connecticut | 7.94 | 59 | Connecticut | 9.45 | ||||
| 60 | Akron | 8.24 | 60 | FIU | 7.76 | 60 | Colorado | 6.79 | 60 | Minnesota | 7.59 | 60 | Minnesota | 9.16 | ||||
| 61 | Kent State | 8.20 | 61 | Arkansas State | 7.69 | 61 | Troy | 6.78 | 61 | Boston College | 7.02 | 61 | Boston College | 8.36 | ||||
| 62 | Purdue | 8.12 | 62 | Marshall | 7.59 | 62 | Minnesota | 6.49 | 62 | Oregon | 5.55 | 62 | Oregon | 6.86 | ||||
| 63 | Bowling Green | 8.08 | 63 | North Texas | 7.57 | 63 | UCF | 6.47 | 63 | Oregon State | 5.44 | 63 | Oregon State | 6.71 | ||||
| 64 | Illinois | 8.01 | 64 | TCU | 7.56 | 64 | Southern Miss | 6.41 | 64 | Washington State | 5.07 | 64 | Washington State | 6.26 | ||||
| 65 | Tulsa | 8.00 | 65 | Iowa | 7.52 | 65 | Middle Tennessee | 6.30 | 65 | Washington | 5.04 | 65 | Washington | 6.18 | ||||
| 66 | Toledo | 7.95 | 66 | Kansas State | 7.46 | 66 | Louisiana-Monroe | 6.26 | 66 | UAB | 3.96 | 66 | Troy | 0.00 | ||||
| 67 | Texas | 7.93 | 67 | Houston | 7.44 | 67 | Louisiana Tech | 6.20 | 67 | Troy | 3.94 | 67 | UAB | 0.00 | ||||
| 68 | Oklahoma | 7.90 | 68 | Rice | 7.44 | 68 | Memphis | 6.14 | 68 | UCF | 3.76 | 68 | Arkansas State | 0.00 | ||||
| 69 | Penn State | 7.81 | 69 | Ohio | 7.40 | 69 | Tulane | 6.10 | 69 | Southern Miss | 3.75 | 69 | Fresno State | 0.00 | ||||
| 70 | San Diego State | 7.76 | 70 | Miami (OH) | 7.39 | 70 | Boston College | 6.06 | 70 | Louisiana-Monroe | 3.67 | 70 | San Diego State | 0.00 | ||||
| 71 | Notre Dame | 7.69 | 71 | Texas Tech | 7.28 | 71 | Florida Atlantic | 6.04 | 71 | Middle Tennessee | 3.67 | 71 | San Jose State | 0.00 | ||||
| 72 | Oklahoma State | 7.67 | 72 | Wisconsin | 7.25 | 72 | SMU | 6.02 | 72 | Louisiana Tech | 3.64 | 72 | Air Force | 0.00 | ||||
| 73 | Missouri | 7.65 | 73 | Ball State | 7.10 | 73 | Western Kentucky | 6.00 | 73 | Memphis | 3.59 | 73 | Colorado State | 0.00 | ||||
| 74 | Eastern Michigan | 7.64 | 74 | ECU | 7.10 | 74 | Louisiana-Lafayette | 5.99 | 74 | Tulane | 3.57 | 74 | FIU | 0.00 | ||||
| 75 | Michigan | 7.61 | 75 | Arizona State | 7.07 | 75 | FIU | 5.91 | 75 | SMU | 3.56 | 75 | Florida Atlantic | 0.00 | ||||
| 76 | Temple | 7.50 | 76 | Navy | 6.93 | 76 | Arkansas State | 5.87 | 76 | Louisiana-Lafayette | 3.52 | 76 | UCF | 0.00 | ||||
| 77 | Western Michigan | 7.43 | 77 | Akron | 6.93 | 77 | North Texas | 5.82 | 77 | Florida Atlantic | 3.52 | 77 | Hawaii | 0.00 | ||||
| 78 | Northwestern | 7.36 | 78 | Iowa State | 6.91 | 78 | TCU | 5.82 | 78 | Western Kentucky | 3.49 | 78 | Boise State | 0.00 | ||||
| 79 | Michigan State | 7.25 | 79 | Kent State | 6.89 | 79 | Marshall | 5.76 | 79 | FIU | 3.44 | 79 | Idaho | 0.00 | ||||
| 80 | Northern Illinois | 7.18 | 80 | Bowling Green | 6.80 | 80 | Houston | 5.72 | 80 | North Texas | 3.44 | 80 | Northern Illinois | 0.00 | ||||
| 81 | Rutgers | 7.02 | 81 | Nebraska | 6.79 | 81 | Rice | 5.72 | 81 | TCU | 3.44 | 81 | Ball State | 0.00 | ||||
| 82 | Kansas | 7.01 | 82 | Tulsa | 6.78 | 82 | Ohio | 5.62 | 82 | Arkansas State | 3.43 | 82 | Notre Dame | 0.00 | ||||
| 83 | Iowa | 6.68 | 83 | Syracuse | 6.73 | 83 | Miami (OH) | 5.61 | 83 | Houston | 3.38 | 83 | Western Kentucky | 0.00 | ||||
| 84 | Central Michigan | 6.64 | 84 | Toledo | 6.69 | 84 | Ball State | 5.40 | 84 | Rice | 3.38 | 84 | Louisiana Tech | 0.00 | ||||
| 85 | Buffalo | 6.61 | 85 | San Diego State | 6.65 | 85 | ECU | 5.37 | 85 | Marshall | 3.34 | 85 | Louisiana-Lafayette | 0.00 | ||||
| 86 | Kansas State | 6.61 | 86 | Arizona | 6.53 | 86 | Akron | 5.26 | 86 | Miami (OH) | 3.26 | 86 | Louisiana-Monroe | 0.00 | ||||
| 87 | UNLV | 6.56 | 87 | Notre Dame | 6.47 | 87 | Navy | 5.25 | 87 | Ohio | 3.26 | 87 | Tulane | 0.00 | ||||
| 88 | Fresno State | 6.47 | 88 | Eastern Michigan | 6.43 | 88 | Kent State | 5.23 | 88 | Ball State | 3.14 | 88 | Navy | 0.00 | ||||
| 89 | Wisconsin | 6.45 | 89 | Temple | 6.30 | 89 | Tulsa | 5.20 | 89 | ECU | 3.11 | 89 | Central Michigan | 0.00 | ||||
| 90 | Texas Tech | 6.42 | 90 | Stanford | 6.29 | 90 | San Diego State | 5.17 | 90 | San Diego State | 3.10 | 90 | Eastern Michigan | 0.00 | ||||
| 91 | Army | 6.41 | 91 | Western Michigan | 6.25 | 91 | Bowling Green | 5.16 | 91 | Tulsa | 3.06 | 91 | Western Michigan | 0.00 | ||||
| 92 | Arizona State | 6.20 | 92 | California | 6.17 | 92 | Toledo | 5.08 | 92 | Akron | 3.05 | 92 | Southern Miss | 0.00 | ||||
| 93 | Iowa State | 6.13 | 93 | Northern Illinois | 6.05 | 93 | Notre Dame | 4.92 | 93 | Kent State | 3.04 | 93 | Nevada | 0.00 | ||||
| 94 | Nebraska | 6.02 | 94 | Connecticut | 6.03 | 94 | Eastern Michigan | 4.88 | 94 | Navy | 3.04 | 94 | UNLV | 0.00 | ||||
| 95 | Syracuse | 6.01 | 95 | Colorado | 5.86 | 95 | Temple | 4.77 | 95 | Bowling Green | 3.00 | 95 | New Mexico | 0.00 | ||||
| 96 | Arizona | 5.73 | 96 | Minnesota | 5.67 | 96 | Western Michigan | 4.75 | 96 | Toledo | 2.95 | 96 | New Mexico State | 0.00 | ||||
| 97 | New Mexico | 5.63 | 97 | UNLV | 5.62 | 97 | Oregon | 4.67 | 97 | Notre Dame | 2.87 | 97 | Army | 0.00 | ||||
| 98 | San Jose State | 5.62 | 98 | Central Michigan | 5.59 | 98 | Northern Illinois | 4.61 | 98 | Eastern Michigan | 2.84 | 98 | Buffalo | 0.00 | ||||
| 99 | New Mexico State | 5.56 | 99 | Buffalo | 5.56 | 99 | Oregon State | 4.58 | 99 | Western Michigan | 2.77 | 99 | ECU | 0.00 | ||||
| 100 | UTEP | 5.52 | 100 | Fresno State | 5.54 | 100 | UNLV | 4.36 | 100 | Temple | 2.76 | 100 | Akron | 0.00 | ||||
| 101 | Stanford | 5.52 | 101 | Army | 5.38 | 101 | Fresno State | 4.30 | 101 | Northern Illinois | 2.69 | 101 | Bowling Green | 0.00 | ||||
| 102 | Air Force | 5.41 | 102 | Boston College | 5.33 | 102 | Washington State | 4.27 | 102 | UNLV | 2.61 | 102 | Kent State | 0.00 | ||||
| 103 | California | 5.41 | 103 | San Jose State | 4.81 | 103 | Washington | 4.27 | 103 | Fresno State | 2.58 | 103 | Miami (OH) | 0.00 | ||||
| 104 | Connecticut | 5.39 | 104 | New Mexico | 4.80 | 104 | Central Michigan | 4.25 | 104 | Central Michigan | 2.47 | 104 | Ohio | 0.00 | ||||
| 105 | Colorado | 5.16 | 105 | New Mexico State | 4.74 | 105 | Buffalo | 4.22 | 105 | Buffalo | 2.45 | 105 | Toledo | 0.00 | ||||
| 106 | Nevada | 5.09 | 106 | UTEP | 4.71 | 106 | Army | 4.07 | 106 | Army | 2.36 | 106 | Tulsa | 0.00 | ||||
| 107 | Minnesota | 5.03 | 107 | Air Force | 4.61 | 107 | San Jose State | 3.73 | 107 | San Jose State | 2.23 | 107 | Temple | 0.00 | ||||
| 108 | BYU | 5.01 | 108 | Nevada | 4.35 | 108 | New Mexico | 3.71 | 108 | New Mexico | 2.21 | 108 | Memphis | 0.00 | ||||
| 109 | Colorado State | 5.00 | 109 | BYU | 4.29 | 109 | New Mexico State | 3.67 | 109 | New Mexico State | 2.18 | 109 | Middle Tennessee | 0.00 | ||||
| 110 | Utah | 4.90 | 110 | Colorado State | 4.25 | 110 | UTEP | 3.64 | 110 | UTEP | 2.16 | 110 | Houston | 0.00 | ||||
| 111 | Boston College | 4.76 | 111 | Utah | 4.19 | 111 | Air Force | 3.56 | 111 | Air Force | 2.11 | 111 | North Texas | 0.00 | ||||
| 112 | Wyoming | 4.70 | 112 | Oregon | 4.03 | 112 | Nevada | 3.38 | 112 | Nevada | 2.02 | 112 | Rice | 0.00 | ||||
| 113 | Utah State | 4.56 | 113 | Wyoming | 4.01 | 113 | BYU | 3.32 | 113 | BYU | 1.99 | 113 | SMU | 0.00 | ||||
| 114 | Boise State | 3.96 | 114 | Oregon State | 3.96 | 114 | Colorado State | 3.28 | 114 | Colorado State | 1.95 | 114 | TCU | 0.00 | ||||
| 115 | Oregon | 3.55 | 115 | Utah State | 3.90 | 115 | Utah | 3.25 | 115 | Utah | 1.95 | 115 | UTEP | 0.00 | ||||
| 116 | Oregon State | 3.49 | 116 | Washington | 3.70 | 116 | Wyoming | 3.09 | 116 | Wyoming | 1.84 | 116 | BYU | 0.00 | ||||
| 117 | Washington | 3.26 | 117 | Washington State | 3.69 | 117 | Utah State | 3.02 | 117 | Utah State | 1.80 | 117 | Utah | 0.00 | ||||
| 118 | Washington State | 3.25 | 118 | Boise State | 3.38 | 118 | Boise State | 2.62 | 118 | Boise State | 1.56 | 118 | Utah State | 0.00 | ||||
| 119 | Idaho | 3.24 | 119 | Idaho | 2.76 | 119 | Idaho | 2.13 | 119 | Idaho | 1.27 | 119 | Marshall | 0.00 | ||||
| 120 | Hawaii | 1.84 | 120 | Hawaii | 1.58 | 120 | Hawaii | 1.23 | 120 | Hawaii | 0.75 | 120 | Wyoming | 0.00 |

Added 12/10/2009