Normalized Probabilities Case 3, Sub-analysis 1: 2006 - 2009 Rivals 250 Lists as Population Source, Scaling Competition by 10-Year Winning Percentage
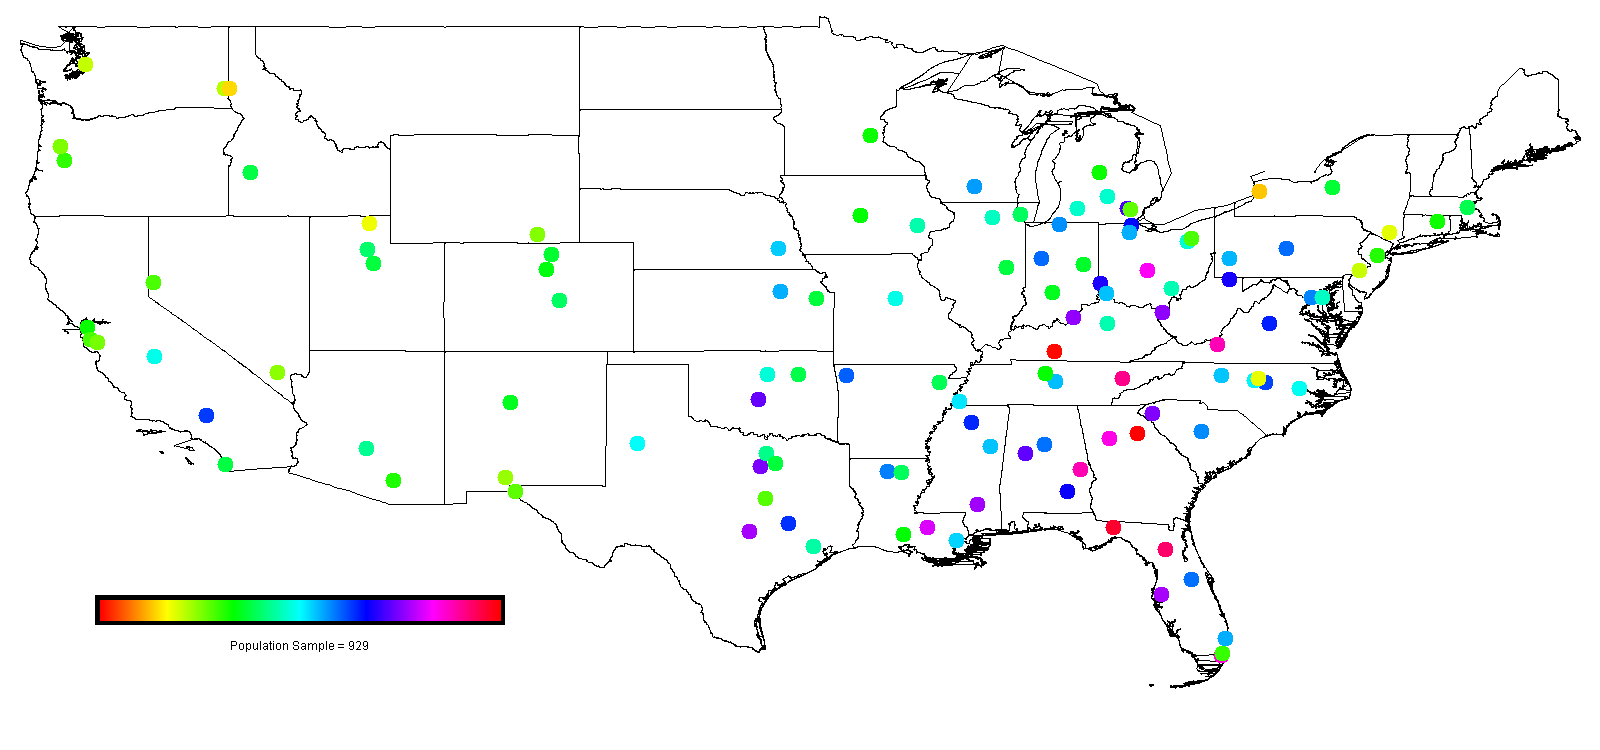
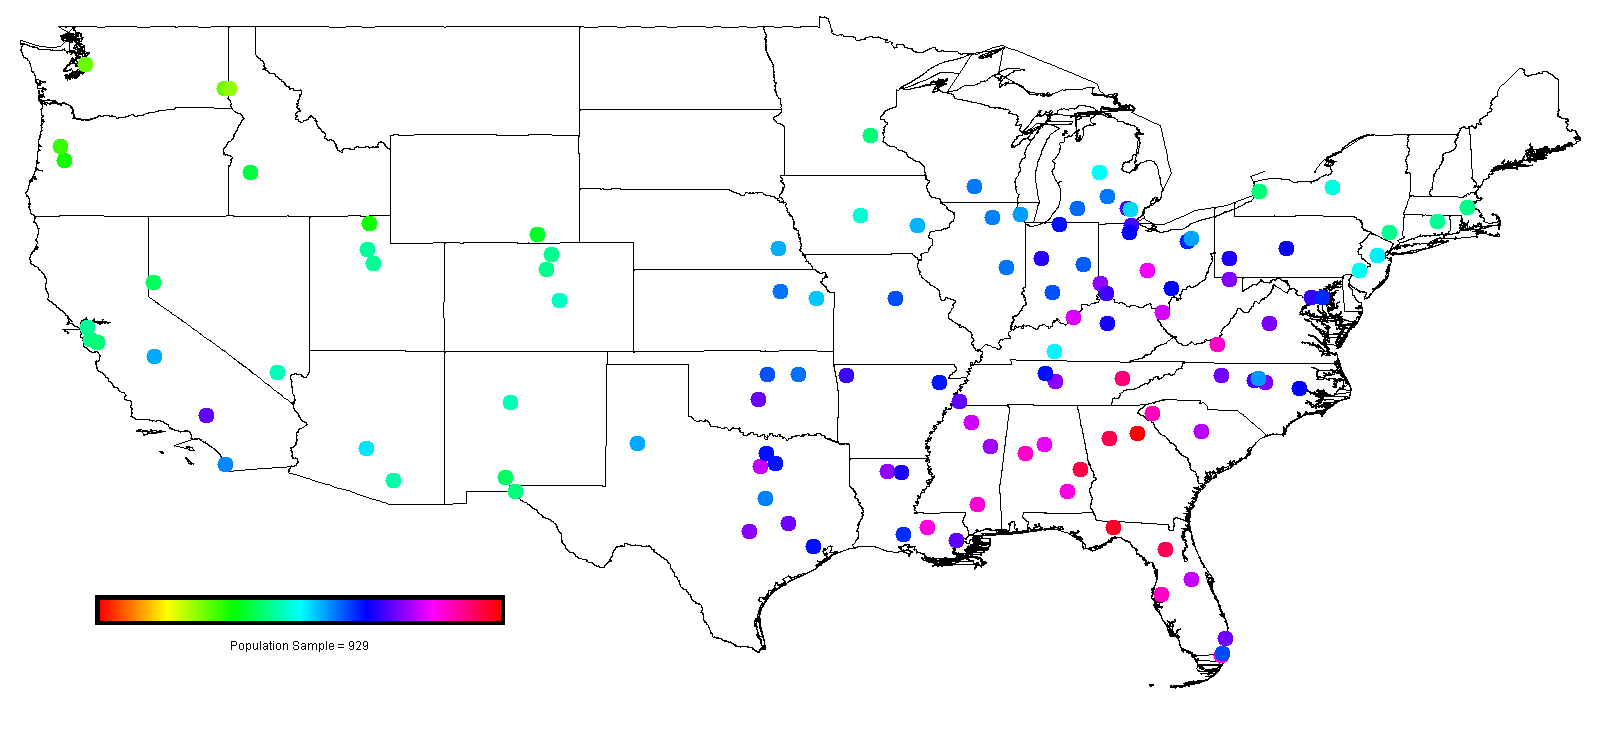
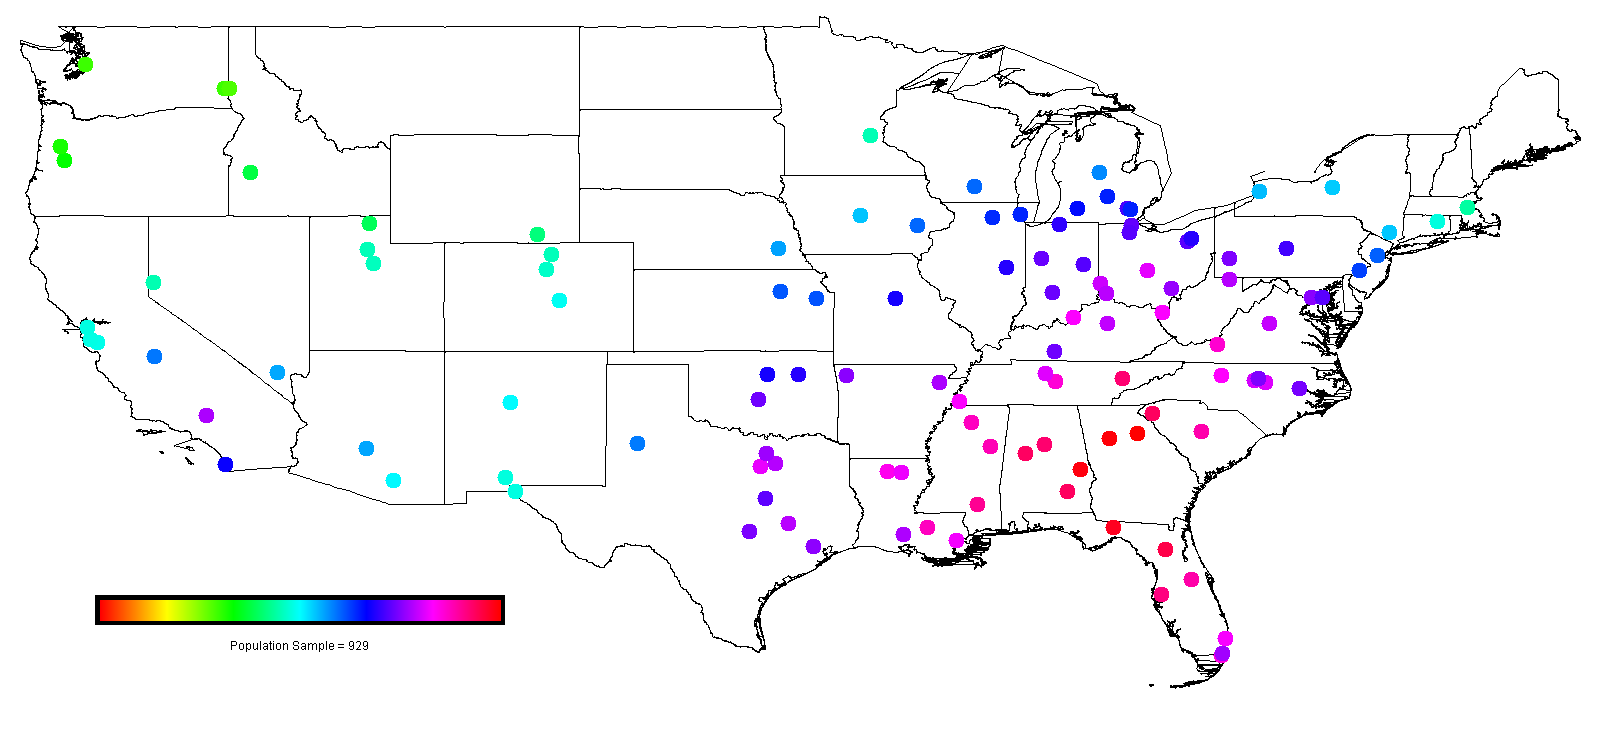
Just as in the "normal" Case 3-2, this study scales schools by their winning percentage over the past ten years. It's slightly different in that in order to be more accurate I actually broke the recruits down by year and used the 10-year winning percentage that the recruits would have experienced (i.e. the 2006 Rivals class follows the 1997-2006 winning percentage, etc.). Given that it follows the normalized probability model, the results are somewhat different than the effective population Case 3-2. As discussed in the methods section, the maps are not very interesting, it is the tables rather that have the real interesting data hence they are shown immediately below with the maps below them.
The population source--the Rivals 250 lists--makes this particularly interesting because we know where these recruits actually chose to enroll and we can assume that every program wanted them. Therefore the numbers calculated--which represent how many of these Rivals 250 recruits a given school should have attracted given the only two criteria are geography and conference affiliation--can be compared to what actually happened.
The problem with this case (and which is addressed in the next), is that I haven't scaled down the non-Big 6 teams, which the previous case makes clear is a good assumption. As a result the errors here aren't much better than in Case 3-1; in fact they're worse.
As a result, I'm not going to spend too much time looking at the results because the lack of taking into account conferences really skews the results (hence no under/overperformers section). But they are here for perusal. I should note that as in the normalized population Case 3-2, the "scale factor" for winning percentage is really more of a dilution factor; that is winning percentage has the greatest effect on recruiting when the dilution factor is zero. Also, I've excluded years in which certain schools weren't competing in I-A (this ends up giving Western Kentucky no years to draw from so I let them stay at zero winning percentage).
A note about the images. The circles indicate the number of recruits and location of the 120 schools. I've tried to make it easier to distinguish good red and bad red here--the reds should indicate the best and the worst bottom out in the orange end of the spectrum (with the possible exception of Western Kentucky which still looks red to me).
Table I - Actual vs. Modeled Number of Recruits, Teams Sorted Alphabetically
| College | 0 | 1 | 2 | 4 | 8 | Actual | College | 0 | 1 | 2 | 4 | 8 | Actual | College | 0 | 1 | 2 | 4 | 8 | Actual | ||
| Air Force | 6.28 | 5.70 | 5.59 | 5.51 | 5.46 | 0.00 | Kansas | 5.89 | 6.64 | 6.79 | 6.89 | 6.95 | 0.93 | Purdue | 9.53 | 8.59 | 8.40 | 8.27 | 8.20 | 0.00 | ||
| Akron | 7.51 | 8.00 | 8.10 | 8.16 | 8.20 | 0.00 | Kansas State | 8.80 | 7.34 | 7.04 | 6.85 | 6.73 | 1.86 | Rice | 7.01 | 8.17 | 8.40 | 8.56 | 8.65 | 0.00 | ||
| Alabama | 11.66 | 10.85 | 10.69 | 10.58 | 10.52 | 39.06 | Kent State | 4.49 | 6.96 | 7.45 | 7.78 | 7.98 | 0.00 | Rutgers | 4.90 | 6.32 | 6.60 | 6.79 | 6.90 | 6.51 | ||
| Arizona | 4.96 | 5.47 | 5.58 | 5.65 | 5.69 | 9.30 | Kentucky | 7.14 | 8.49 | 8.76 | 8.94 | 9.05 | 1.86 | San Diego State | 5.97 | 7.16 | 7.40 | 7.56 | 7.66 | 0.00 | ||
| Arizona State | 6.80 | 6.40 | 6.32 | 6.27 | 6.24 | 10.23 | Louisiana Tech | 9.30 | 9.47 | 9.50 | 9.53 | 9.54 | 0.00 | San Jose State | 4.04 | 5.09 | 5.30 | 5.44 | 5.53 | 0.00 | ||
| Arkansas | 9.63 | 8.80 | 8.64 | 8.53 | 8.46 | 9.30 | Louisiana-Lafayette | 5.31 | 7.92 | 8.45 | 8.80 | 9.00 | 0.00 | SMU | 5.90 | 8.11 | 8.55 | 8.85 | 9.02 | 0.00 | ||
| Arkansas State | 6.16 | 8.12 | 8.51 | 8.78 | 8.93 | 0.00 | Louisiana-Monroe | 6.23 | 8.51 | 8.97 | 9.27 | 9.45 | 0.00 | South Carolina | 9.17 | 9.81 | 9.93 | 10.02 | 10.07 | 17.67 | ||
| Army | 2.88 | 5.24 | 5.71 | 6.02 | 6.20 | 0.00 | Louisville | 12.17 | 10.07 | 9.65 | 9.38 | 9.21 | 2.79 | South Florida | 12.41 | 10.87 | 10.56 | 10.35 | 10.23 | 2.79 | ||
| Auburn | 14.14 | 11.93 | 11.48 | 11.19 | 11.01 | 23.25 | LSU | 12.96 | 10.65 | 10.19 | 9.88 | 9.69 | 45.57 | Southern Miss | 12.35 | 10.75 | 10.43 | 10.21 | 10.08 | 0.93 | ||
| Ball State | 5.71 | 7.53 | 7.89 | 8.13 | 8.28 | 0.00 | Marshall | 12.14 | 10.07 | 9.66 | 9.38 | 9.22 | 0.00 | Stanford | 4.53 | 5.18 | 5.32 | 5.41 | 5.46 | 6.51 | ||
| Baylor | 4.37 | 7.24 | 7.82 | 8.20 | 8.43 | 1.86 | Maryland | 9.25 | 8.71 | 8.60 | 8.53 | 8.49 | 9.30 | Syracuse | 5.83 | 5.95 | 5.97 | 5.99 | 5.99 | 0.00 | ||
| Boise State | 5.99 | 4.64 | 4.37 | 4.19 | 4.08 | 0.00 | Memphis | 8.21 | 9.09 | 9.27 | 9.39 | 9.46 | 0.00 | TCU | 11.94 | 9.91 | 9.51 | 9.24 | 9.08 | 1.86 | ||
| Boston College | 6.11 | 5.21 | 5.03 | 4.91 | 4.84 | 6.51 | Miami | 13.73 | 10.68 | 10.07 | 9.65 | 9.41 | 33.48 | Temple | 3.16 | 6.06 | 6.64 | 7.03 | 7.25 | 0.00 | ||
| Bowling Green | 8.80 | 8.32 | 8.22 | 8.16 | 8.12 | 0.00 | Miami (OH) | 10.96 | 9.51 | 9.21 | 9.02 | 8.91 | 0.00 | Tennessee | 14.55 | 11.49 | 10.87 | 10.46 | 10.22 | 20.46 | ||
| Buffalo | 1.99 | 5.08 | 5.69 | 6.10 | 6.34 | 0.00 | Michigan | 11.44 | 8.88 | 8.37 | 8.03 | 7.83 | 38.13 | Texas | 12.39 | 9.42 | 8.82 | 8.42 | 8.19 | 48.36 | ||
| BYU | 5.91 | 5.31 | 5.19 | 5.11 | 5.07 | 0.93 | Michigan State | 7.45 | 7.31 | 7.29 | 7.27 | 7.26 | 6.51 | Texas A&M | 10.14 | 9.20 | 9.01 | 8.88 | 8.81 | 9.30 | ||
| California | 5.20 | 5.34 | 5.37 | 5.39 | 5.40 | 14.88 | Middle Tennessee | 8.64 | 9.44 | 9.60 | 9.71 | 9.77 | 0.00 | Texas Tech | 7.89 | 6.91 | 6.71 | 6.58 | 6.50 | 3.72 | ||
| Central Michigan | 5.18 | 6.15 | 6.35 | 6.48 | 6.56 | 0.00 | Minnesota | 5.17 | 5.08 | 5.06 | 5.05 | 5.04 | 3.72 | Toledo | 10.58 | 8.82 | 8.47 | 8.24 | 8.10 | 0.00 | ||
| Cincinnati | 8.61 | 8.82 | 8.86 | 8.89 | 8.90 | 0.93 | Mississippi State | 8.59 | 9.61 | 9.81 | 9.95 | 10.03 | 10.23 | Troy | 10.73 | 10.63 | 10.61 | 10.59 | 10.59 | 0.00 | ||
| Clemson | 12.00 | 10.94 | 10.73 | 10.59 | 10.51 | 26.04 | Missouri | 7.69 | 7.67 | 7.66 | 7.66 | 7.66 | 2.79 | Tulane | 8.42 | 9.09 | 9.23 | 9.32 | 9.37 | 0.00 | ||
| Colorado | 5.41 | 5.24 | 5.21 | 5.19 | 5.17 | 10.23 | Navy | 7.33 | 7.95 | 8.08 | 8.16 | 8.21 | 0.00 | Tulsa | 6.06 | 7.35 | 7.61 | 7.78 | 7.88 | 0.93 | ||
| Colorado State | 5.79 | 5.26 | 5.16 | 5.08 | 5.04 | 0.00 | NC State | 9.93 | 9.34 | 9.22 | 9.14 | 9.10 | 3.72 | UAB | 9.44 | 10.22 | 10.37 | 10.48 | 10.54 | 0.00 | ||
| Connecticut | 5.13 | 5.30 | 5.34 | 5.36 | 5.37 | 0.00 | Nebraska | 8.50 | 6.85 | 6.52 | 6.30 | 6.17 | 7.44 | UCF | 9.46 | 9.90 | 9.99 | 10.05 | 10.08 | 0.93 | ||
| Duke | 2.81 | 7.03 | 7.87 | 8.44 | 8.77 | 2.79 | Nevada | 4.49 | 4.89 | 4.97 | 5.02 | 5.06 | 0.00 | UCLA | 10.04 | 9.10 | 8.91 | 8.78 | 8.71 | 27.90 | ||
| Eastern Michigan | 4.27 | 6.51 | 6.96 | 7.26 | 7.44 | 0.00 | New Mexico | 5.60 | 5.62 | 5.62 | 5.62 | 5.63 | 0.00 | UNLV | 3.79 | 5.63 | 6.00 | 6.25 | 6.40 | 0.00 | ||
| ECU | 7.83 | 8.25 | 8.33 | 8.39 | 8.42 | 0.00 | New Mexico State | 3.68 | 4.93 | 5.18 | 5.35 | 5.45 | 0.00 | USC | 12.28 | 9.85 | 9.36 | 9.03 | 8.84 | 53.01 | ||
| FIU | 4.70 | 7.69 | 8.30 | 8.70 | 8.94 | 0.93 | North Carolina | 8.07 | 8.82 | 8.97 | 9.07 | 9.13 | 16.74 | Utah | 6.38 | 5.40 | 5.20 | 5.07 | 4.99 | 0.93 | ||
| Florida | 14.90 | 11.81 | 11.18 | 10.76 | 10.51 | 52.08 | North Texas | 6.73 | 8.18 | 8.47 | 8.67 | 8.78 | 0.00 | Utah State | 2.75 | 3.95 | 4.20 | 4.36 | 4.45 | 0.00 | ||
| Florida Atlantic | 8.82 | 9.22 | 9.30 | 9.35 | 9.38 | 0.00 | Northern Illinois | 7.31 | 7.22 | 7.21 | 7.20 | 7.19 | 0.00 | UTEP | 4.30 | 5.11 | 5.27 | 5.38 | 5.45 | 0.00 | ||
| Florida State | 15.53 | 12.19 | 11.51 | 11.06 | 10.80 | 35.34 | Northwestern | 6.26 | 6.99 | 7.14 | 7.23 | 7.29 | 0.93 | Vanderbilt | 5.23 | 8.18 | 8.77 | 9.17 | 9.40 | 0.00 | ||
| Fresno State | 7.73 | 6.89 | 6.72 | 6.61 | 6.54 | 0.00 | Notre Dame | 9.14 | 8.17 | 7.98 | 7.85 | 7.77 | 39.99 | Virginia | 10.33 | 9.31 | 9.10 | 8.97 | 8.89 | 7.44 | ||
| Georgia | 16.02 | 12.49 | 11.77 | 11.30 | 11.02 | 39.99 | Ohio | 7.18 | 8.26 | 8.48 | 8.63 | 8.71 | 0.00 | Virginia Tech | 14.09 | 10.83 | 10.18 | 9.75 | 9.49 | 11.16 | ||
| Georgia Tech | 13.59 | 11.83 | 11.48 | 11.24 | 11.10 | 7.44 | Ohio State | 13.42 | 10.26 | 9.63 | 9.21 | 8.96 | 39.99 | Wake Forest | 8.57 | 9.20 | 9.33 | 9.41 | 9.46 | 0.00 | ||
| Hawaii | 1.96 | 1.88 | 1.86 | 1.85 | 1.84 | 0.00 | Oklahoma | 11.71 | 9.17 | 8.66 | 8.33 | 8.13 | 32.55 | Washington | 3.21 | 3.24 | 3.25 | 3.26 | 3.26 | 6.51 | ||
| Houston | 7.08 | 8.19 | 8.42 | 8.57 | 8.66 | 0.00 | Oklahoma State | 7.55 | 7.63 | 7.64 | 7.65 | 7.66 | 11.16 | Washington State | 3.33 | 3.28 | 3.26 | 3.26 | 3.25 | 0.00 | ||
| Idaho | 2.20 | 2.89 | 3.03 | 3.13 | 3.18 | 0.00 | Ole Miss | 10.25 | 9.96 | 9.91 | 9.87 | 9.85 | 9.30 | West Virginia | 10.86 | 9.36 | 9.06 | 8.86 | 8.74 | 4.65 | ||
| Illinois | 5.93 | 7.32 | 7.59 | 7.78 | 7.89 | 13.02 | Oregon | 4.77 | 3.96 | 3.80 | 3.69 | 3.62 | 12.09 | Western Kentucky | 0.00 | 6.24 | 7.49 | 8.33 | 8.82 | 0.00 | ||
| Indiana | 5.59 | 7.61 | 8.02 | 8.29 | 8.45 | 0.00 | Oregon State | 3.94 | 3.64 | 3.58 | 3.54 | 3.51 | 2.79 | Western Michigan | 7.41 | 7.42 | 7.42 | 7.42 | 7.43 | 0.93 | ||
| Iowa | 7.09 | 6.82 | 6.77 | 6.73 | 6.71 | 6.51 | Penn State | 9.52 | 8.37 | 8.15 | 8.00 | 7.91 | 25.11 | Wisconsin | 8.99 | 7.29 | 6.95 | 6.73 | 6.60 | 6.51 | ||
| Iowa State | 5.28 | 5.85 | 5.96 | 6.04 | 6.08 | 0.93 | Pittsburgh | 8.73 | 8.51 | 8.47 | 8.44 | 8.42 | 14.88 | Wyoming | 3.89 | 4.43 | 4.54 | 4.61 | 4.66 | 0.00 | ||
| Total Deviation from Actual | 959.55 | 1033.76 | 1050.91 | 1062.61 | 1069.50 | |||||||||||||||||
Table II - Recruiting Ranking, Actual vs. Modeled, Teams Sorted Alphabetically
| College | 0 | 1 | 2 | 4 | 8 | Actual | College | 0 | 1 | 2 | 4 | 8 | Actual | College | 0 | 1 | 2 | 4 | 8 | Actual | ||
| Air Force | 71 | 93 | 97 | 98 | 99 | 68 | Kansas | 82 | 84 | 82 | 81 | 81 | 61 | Purdue | 32 | 45 | 55 | 59 | 60 | 68 | ||
| Akron | 58 | 60 | 61 | 62 | 61 | 68 | Kansas State | 42 | 70 | 79 | 82 | 83 | 54 | Rice | 67 | 56 | 54 | 49 | 51 | 68 | ||
| Alabama | 20 | 9 | 8 | 8 | 7 | 8 | Kent State | 102 | 79 | 73 | 69 | 66 | 68 | Rutgers | 97 | 87 | 87 | 83 | 82 | 40 | ||
| Arizona | 96 | 96 | 98 | 96 | 96 | 29 | Kentucky | 64 | 48 | 42 | 37 | 33 | 55 | San Diego State | 78 | 76 | 75 | 74 | 73 | 68 | ||
| Arizona State | 68 | 86 | 90 | 90 | 91 | 26 | Louisiana Tech | 36 | 26 | 25 | 21 | 19 | 68 | San Jose State | 106 | 107 | 102 | 99 | 98 | 68 | ||
| Arkansas | 31 | 43 | 44 | 51 | 53 | 30 | Louisiana-Lafayette | 89 | 62 | 52 | 42 | 35 | 68 | SMU | 81 | 59 | 46 | 41 | 34 | 68 | ||
| Arkansas State | 74 | 58 | 47 | 44 | 38 | 68 | Louisiana-Monroe | 73 | 46 | 37 | 28 | 23 | 68 | South Carolina | 38 | 23 | 17 | 14 | 14 | 18 | ||
| Army | 114 | 103 | 94 | 94 | 92 | 68 | Louisville | 15 | 17 | 21 | 25 | 29 | 49 | South Florida | 11 | 8 | 10 | 11 | 10 | 52 | ||
| Auburn | 5 | 3 | 3 | 3 | 3 | 16 | LSU | 10 | 13 | 13 | 16 | 18 | 4 | Southern Miss | 13 | 11 | 11 | 12 | 12 | 63 | ||
| Ball State | 85 | 67 | 65 | 65 | 58 | 68 | Marshall | 16 | 18 | 20 | 24 | 28 | 68 | Stanford | 100 | 105 | 101 | 100 | 100 | 41 | ||
| Baylor | 103 | 74 | 67 | 61 | 55 | 53 | Maryland | 37 | 44 | 45 | 50 | 52 | 31 | Syracuse | 83 | 91 | 92 | 95 | 95 | 68 | ||
| Boise State | 77 | 112 | 113 | 114 | 114 | 68 | Memphis | 51 | 37 | 29 | 23 | 22 | 68 | TCU | 18 | 20 | 24 | 29 | 32 | 56 | ||
| Boston College | 75 | 104 | 110 | 111 | 111 | 37 | Miami | 7 | 12 | 15 | 20 | 24 | 11 | Temple | 113 | 90 | 86 | 80 | 79 | 68 | ||
| Bowling Green | 43 | 50 | 59 | 64 | 64 | 68 | Miami (OH) | 22 | 25 | 32 | 35 | 39 | 68 | Tennessee | 4 | 6 | 6 | 10 | 11 | 17 | ||
| Buffalo | 118 | 109 | 95 | 92 | 90 | 68 | Michigan | 21 | 39 | 56 | 66 | 70 | 9 | Texas | 12 | 28 | 40 | 54 | 62 | 3 | ||
| BYU | 80 | 99 | 106 | 106 | 106 | 57 | Michigan State | 59 | 72 | 76 | 76 | 78 | 39 | Texas A&M | 28 | 34 | 35 | 39 | 44 | 33 | ||
| California | 92 | 98 | 99 | 101 | 103 | 20 | Middle Tennessee | 45 | 27 | 23 | 19 | 17 | 68 | Texas Tech | 53 | 80 | 85 | 87 | 88 | 47 | ||
| Central Michigan | 93 | 89 | 89 | 88 | 86 | 68 | Minnesota | 94 | 108 | 109 | 109 | 109 | 45 | Toledo | 25 | 40 | 50 | 60 | 65 | 68 | ||
| Cincinnati | 46 | 42 | 39 | 38 | 40 | 58 | Mississippi State | 47 | 24 | 19 | 15 | 15 | 28 | Troy | 24 | 14 | 9 | 6 | 5 | 68 | ||
| Clemson | 17 | 7 | 7 | 7 | 9 | 14 | Missouri | 56 | 64 | 68 | 72 | 74 | 50 | Tulane | 50 | 38 | 30 | 27 | 27 | 68 | ||
| Colorado | 88 | 102 | 104 | 105 | 105 | 27 | Navy | 61 | 61 | 62 | 63 | 59 | 68 | Tulsa | 76 | 69 | 70 | 70 | 69 | 64 | ||
| Colorado State | 84 | 101 | 108 | 107 | 108 | 68 | NC State | 30 | 30 | 31 | 32 | 31 | 46 | UAB | 35 | 16 | 12 | 9 | 6 | 68 | ||
| Connecticut | 95 | 100 | 100 | 103 | 104 | 68 | Nebraska | 49 | 82 | 88 | 89 | 93 | 35 | UCF | 34 | 21 | 16 | 13 | 13 | 65 | ||
| Duke | 115 | 77 | 66 | 52 | 46 | 48 | Nevada | 101 | 111 | 111 | 110 | 107 | 68 | UCLA | 29 | 36 | 38 | 43 | 49 | 13 | ||
| Eastern Michigan | 105 | 85 | 80 | 77 | 75 | 68 | New Mexico | 86 | 95 | 96 | 97 | 97 | 68 | UNLV | 109 | 94 | 91 | 91 | 89 | 68 | ||
| ECU | 54 | 52 | 57 | 55 | 56 | 68 | New Mexico State | 110 | 110 | 107 | 104 | 101 | 68 | USC | 14 | 22 | 26 | 34 | 42 | 1 | ||
| FIU | 99 | 63 | 58 | 45 | 37 | 59 | North Carolina | 52 | 41 | 36 | 33 | 30 | 19 | Utah | 70 | 97 | 105 | 108 | 110 | 66 | ||
| Florida | 3 | 5 | 5 | 5 | 8 | 2 | North Texas | 69 | 54 | 49 | 46 | 45 | 68 | Utah State | 116 | 115 | 114 | 113 | 113 | 68 | ||
| Florida Atlantic | 41 | 32 | 28 | 26 | 26 | 68 | Northern Illinois | 62 | 75 | 77 | 79 | 80 | 68 | UTEP | 104 | 106 | 103 | 102 | 102 | 68 | ||
| Florida State | 2 | 2 | 2 | 4 | 4 | 10 | Northwestern | 72 | 78 | 78 | 78 | 77 | 62 | Vanderbilt | 91 | 55 | 41 | 31 | 25 | 68 | ||
| Fresno State | 55 | 81 | 84 | 86 | 87 | 68 | Notre Dame | 39 | 57 | 64 | 68 | 71 | 6 | Virginia | 26 | 31 | 33 | 36 | 41 | 36 | ||
| Georgia | 1 | 1 | 1 | 1 | 2 | 5 | Ohio | 63 | 51 | 48 | 47 | 48 | 68 | Virginia Tech | 6 | 10 | 14 | 18 | 20 | 25 | ||
| Georgia Tech | 8 | 4 | 4 | 2 | 1 | 34 | Ohio State | 9 | 15 | 22 | 30 | 36 | 7 | Wake Forest | 48 | 33 | 27 | 22 | 21 | 68 | ||
| Hawaii | 119 | 120 | 120 | 120 | 120 | 68 | Oklahoma | 19 | 35 | 43 | 57 | 63 | 12 | Washington | 112 | 118 | 118 | 118 | 117 | 42 | ||
| Houston | 66 | 53 | 53 | 48 | 50 | 68 | Oklahoma State | 57 | 65 | 69 | 73 | 72 | 24 | Washington State | 111 | 117 | 117 | 117 | 118 | 68 | ||
| Idaho | 117 | 119 | 119 | 119 | 119 | 68 | Ole Miss | 27 | 19 | 18 | 17 | 16 | 32 | West Virginia | 23 | 29 | 34 | 40 | 47 | 44 | ||
| Illinois | 79 | 71 | 71 | 71 | 68 | 22 | Oregon | 98 | 114 | 115 | 115 | 115 | 23 | Western Kentucky | 120 | 88 | 72 | 56 | 43 | 68 | ||
| Indiana | 87 | 66 | 63 | 58 | 54 | 68 | Oregon State | 107 | 116 | 116 | 116 | 116 | 51 | Western Michigan | 60 | 68 | 74 | 75 | 76 | 67 | ||
| Iowa | 65 | 83 | 83 | 84 | 84 | 38 | Penn State | 33 | 49 | 60 | 67 | 67 | 15 | Wisconsin | 40 | 73 | 81 | 85 | 85 | 43 | ||
| Iowa State | 90 | 92 | 93 | 93 | 94 | 60 | Pittsburgh | 44 | 47 | 51 | 53 | 57 | 21 | Wyoming | 108 | 113 | 112 | 112 | 112 | 68 |
Table III - Rankings for Each Scale Factor
| Dilution Factor = 0.0 | Dilution Factor = 1.0 | Dilution Factor = 2.0 | Dilution Factor = 4.0 | Dilution Factor = 8.0 | ||||||||||||||
| Rank | College | Recruits | Rank | College | Recruits | Rank | College | Recruits | Rank | College | Recruits | Rank | College | Recruits | ||||
| 1 | Georgia | 16.02 | 1 | Georgia | 12.49 | 1 | Georgia | 11.77 | 1 | Georgia | 11.30 | 1 | Georgia Tech | 11.10 | ||||
| 2 | Florida State | 15.53 | 2 | Florida State | 12.19 | 2 | Florida State | 11.51 | 2 | Georgia Tech | 11.24 | 2 | Georgia | 11.02 | ||||
| 3 | Florida | 14.90 | 3 | Auburn | 11.93 | 3 | Auburn | 11.48 | 3 | Auburn | 11.19 | 3 | Auburn | 11.01 | ||||
| 4 | Tennessee | 14.55 | 4 | Georgia Tech | 11.83 | 4 | Georgia Tech | 11.48 | 4 | Florida State | 11.06 | 4 | Florida State | 10.80 | ||||
| 5 | Auburn | 14.14 | 5 | Florida | 11.81 | 5 | Florida | 11.18 | 5 | Florida | 10.76 | 5 | Troy | 10.59 | ||||
| 6 | Virginia Tech | 14.09 | 6 | Tennessee | 11.49 | 6 | Tennessee | 10.87 | 6 | Troy | 10.59 | 6 | UAB | 10.54 | ||||
| 7 | Miami | 13.73 | 7 | Clemson | 10.94 | 7 | Clemson | 10.73 | 7 | Clemson | 10.59 | 7 | Alabama | 10.52 | ||||
| 8 | Georgia Tech | 13.59 | 8 | South Florida | 10.87 | 8 | Alabama | 10.69 | 8 | Alabama | 10.58 | 8 | Florida | 10.51 | ||||
| 9 | Ohio State | 13.42 | 9 | Alabama | 10.85 | 9 | Troy | 10.61 | 9 | UAB | 10.48 | 9 | Clemson | 10.51 | ||||
| 10 | LSU | 12.96 | 10 | Virginia Tech | 10.83 | 10 | South Florida | 10.56 | 10 | Tennessee | 10.46 | 10 | South Florida | 10.23 | ||||
| 11 | South Florida | 12.41 | 11 | Southern Miss | 10.75 | 11 | Southern Miss | 10.43 | 11 | South Florida | 10.35 | 11 | Tennessee | 10.22 | ||||
| 12 | Texas | 12.39 | 12 | Miami | 10.68 | 12 | UAB | 10.37 | 12 | Southern Miss | 10.21 | 12 | Southern Miss | 10.08 | ||||
| 13 | Southern Miss | 12.35 | 13 | LSU | 10.65 | 13 | LSU | 10.19 | 13 | UCF | 10.05 | 13 | UCF | 10.08 | ||||
| 14 | USC | 12.28 | 14 | Troy | 10.63 | 14 | Virginia Tech | 10.18 | 14 | South Carolina | 10.02 | 14 | South Carolina | 10.07 | ||||
| 15 | Louisville | 12.17 | 15 | Ohio State | 10.26 | 15 | Miami | 10.07 | 15 | Mississippi State | 9.95 | 15 | Mississippi State | 10.03 | ||||
| 16 | Marshall | 12.14 | 16 | UAB | 10.22 | 16 | UCF | 9.99 | 16 | LSU | 9.88 | 16 | Ole Miss | 9.85 | ||||
| 17 | Clemson | 12.00 | 17 | Louisville | 10.07 | 17 | South Carolina | 9.93 | 17 | Ole Miss | 9.87 | 17 | Middle Tennessee | 9.77 | ||||
| 18 | TCU | 11.94 | 18 | Marshall | 10.07 | 18 | Ole Miss | 9.91 | 18 | Virginia Tech | 9.75 | 18 | LSU | 9.69 | ||||
| 19 | Oklahoma | 11.71 | 19 | Ole Miss | 9.96 | 19 | Mississippi State | 9.81 | 19 | Middle Tennessee | 9.71 | 19 | Louisiana Tech | 9.54 | ||||
| 20 | Alabama | 11.66 | 20 | TCU | 9.91 | 20 | Marshall | 9.66 | 20 | Miami | 9.65 | 20 | Virginia Tech | 9.49 | ||||
| 21 | Michigan | 11.44 | 21 | UCF | 9.90 | 21 | Louisville | 9.65 | 21 | Louisiana Tech | 9.53 | 21 | Wake Forest | 9.46 | ||||
| 22 | Miami (OH) | 10.96 | 22 | USC | 9.85 | 22 | Ohio State | 9.63 | 22 | Wake Forest | 9.41 | 22 | Memphis | 9.46 | ||||
| 23 | West Virginia | 10.86 | 23 | South Carolina | 9.81 | 23 | Middle Tennessee | 9.60 | 23 | Memphis | 9.39 | 23 | Louisiana-Monroe | 9.45 | ||||
| 24 | Troy | 10.73 | 24 | Mississippi State | 9.61 | 24 | TCU | 9.51 | 24 | Marshall | 9.38 | 24 | Miami | 9.41 | ||||
| 25 | Toledo | 10.58 | 25 | Miami (OH) | 9.51 | 25 | Louisiana Tech | 9.50 | 25 | Louisville | 9.38 | 25 | Vanderbilt | 9.40 | ||||
| 26 | Virginia | 10.33 | 26 | Louisiana Tech | 9.47 | 26 | USC | 9.36 | 26 | Florida Atlantic | 9.35 | 26 | Florida Atlantic | 9.38 | ||||
| 27 | Ole Miss | 10.25 | 27 | Middle Tennessee | 9.44 | 27 | Wake Forest | 9.33 | 27 | Tulane | 9.32 | 27 | Tulane | 9.37 | ||||
| 28 | Texas A&M | 10.14 | 28 | Texas | 9.42 | 28 | Florida Atlantic | 9.30 | 28 | Louisiana-Monroe | 9.27 | 28 | Marshall | 9.22 | ||||
| 29 | UCLA | 10.04 | 29 | West Virginia | 9.36 | 29 | Memphis | 9.27 | 29 | TCU | 9.24 | 29 | Louisville | 9.21 | ||||
| 30 | NC State | 9.93 | 30 | NC State | 9.34 | 30 | Tulane | 9.23 | 30 | Ohio State | 9.21 | 30 | North Carolina | 9.13 | ||||
| 31 | Arkansas | 9.63 | 31 | Virginia | 9.31 | 31 | NC State | 9.22 | 31 | Vanderbilt | 9.17 | 31 | NC State | 9.10 | ||||
| 32 | Purdue | 9.53 | 32 | Florida Atlantic | 9.22 | 32 | Miami (OH) | 9.21 | 32 | NC State | 9.14 | 32 | TCU | 9.08 | ||||
| 33 | Penn State | 9.52 | 33 | Wake Forest | 9.20 | 33 | Virginia | 9.10 | 33 | North Carolina | 9.07 | 33 | Kentucky | 9.05 | ||||
| 34 | UCF | 9.46 | 34 | Texas A&M | 9.20 | 34 | West Virginia | 9.06 | 34 | USC | 9.03 | 34 | SMU | 9.02 | ||||
| 35 | UAB | 9.44 | 35 | Oklahoma | 9.17 | 35 | Texas A&M | 9.01 | 35 | Miami (OH) | 9.02 | 35 | Louisiana-Lafayette | 9.00 | ||||
| 36 | Louisiana Tech | 9.30 | 36 | UCLA | 9.10 | 36 | North Carolina | 8.97 | 36 | Virginia | 8.97 | 36 | Ohio State | 8.96 | ||||
| 37 | Maryland | 9.25 | 37 | Memphis | 9.09 | 37 | Louisiana-Monroe | 8.97 | 37 | Kentucky | 8.94 | 37 | FIU | 8.94 | ||||
| 38 | South Carolina | 9.17 | 38 | Tulane | 9.09 | 38 | UCLA | 8.91 | 38 | Cincinnati | 8.89 | 38 | Arkansas State | 8.93 | ||||
| 39 | Notre Dame | 9.14 | 39 | Michigan | 8.88 | 39 | Cincinnati | 8.86 | 39 | Texas A&M | 8.88 | 39 | Miami (OH) | 8.91 | ||||
| 40 | Wisconsin | 8.99 | 40 | Toledo | 8.82 | 40 | Texas | 8.82 | 40 | West Virginia | 8.86 | 40 | Cincinnati | 8.90 | ||||
| 41 | Florida Atlantic | 8.82 | 41 | North Carolina | 8.82 | 41 | Vanderbilt | 8.77 | 41 | SMU | 8.85 | 41 | Virginia | 8.89 | ||||
| 42 | Kansas State | 8.80 | 42 | Cincinnati | 8.82 | 42 | Kentucky | 8.76 | 42 | Louisiana-Lafayette | 8.80 | 42 | USC | 8.84 | ||||
| 43 | Bowling Green | 8.80 | 43 | Arkansas | 8.80 | 43 | Oklahoma | 8.66 | 43 | UCLA | 8.78 | 43 | Western Kentucky | 8.82 | ||||
| 44 | Pittsburgh | 8.73 | 44 | Maryland | 8.71 | 44 | Arkansas | 8.64 | 44 | Arkansas State | 8.78 | 44 | Texas A&M | 8.81 | ||||
| 45 | Middle Tennessee | 8.64 | 45 | Purdue | 8.59 | 45 | Maryland | 8.60 | 45 | FIU | 8.70 | 45 | North Texas | 8.78 | ||||
| 46 | Cincinnati | 8.61 | 46 | Louisiana-Monroe | 8.51 | 46 | SMU | 8.55 | 46 | North Texas | 8.67 | 46 | Duke | 8.77 | ||||
| 47 | Mississippi State | 8.59 | 47 | Pittsburgh | 8.51 | 47 | Arkansas State | 8.51 | 47 | Ohio | 8.63 | 47 | West Virginia | 8.74 | ||||
| 48 | Wake Forest | 8.57 | 48 | Kentucky | 8.49 | 48 | Ohio | 8.48 | 48 | Houston | 8.57 | 48 | Ohio | 8.71 | ||||
| 49 | Nebraska | 8.50 | 49 | Penn State | 8.37 | 49 | North Texas | 8.47 | 49 | Rice | 8.56 | 49 | UCLA | 8.71 | ||||
| 50 | Tulane | 8.42 | 50 | Bowling Green | 8.32 | 50 | Toledo | 8.47 | 50 | Maryland | 8.53 | 50 | Houston | 8.66 | ||||
| 51 | Memphis | 8.21 | 51 | Ohio | 8.26 | 51 | Pittsburgh | 8.47 | 51 | Arkansas | 8.53 | 51 | Rice | 8.65 | ||||
| 52 | North Carolina | 8.07 | 52 | ECU | 8.25 | 52 | Louisiana-Lafayette | 8.45 | 52 | Duke | 8.44 | 52 | Maryland | 8.49 | ||||
| 53 | Texas Tech | 7.89 | 53 | Houston | 8.19 | 53 | Houston | 8.42 | 53 | Pittsburgh | 8.44 | 53 | Arkansas | 8.46 | ||||
| 54 | ECU | 7.83 | 54 | North Texas | 8.18 | 54 | Rice | 8.40 | 54 | Texas | 8.42 | 54 | Indiana | 8.45 | ||||
| 55 | Fresno State | 7.73 | 55 | Vanderbilt | 8.18 | 55 | Purdue | 8.40 | 55 | ECU | 8.39 | 55 | Baylor | 8.43 | ||||
| 56 | Missouri | 7.69 | 56 | Rice | 8.17 | 56 | Michigan | 8.37 | 56 | Western Kentucky | 8.33 | 56 | ECU | 8.42 | ||||
| 57 | Oklahoma State | 7.55 | 57 | Notre Dame | 8.17 | 57 | ECU | 8.33 | 57 | Oklahoma | 8.33 | 57 | Pittsburgh | 8.42 | ||||
| 58 | Akron | 7.51 | 58 | Arkansas State | 8.12 | 58 | FIU | 8.30 | 58 | Indiana | 8.29 | 58 | Ball State | 8.28 | ||||
| 59 | Michigan State | 7.45 | 59 | SMU | 8.11 | 59 | Bowling Green | 8.22 | 59 | Purdue | 8.27 | 59 | Navy | 8.21 | ||||
| 60 | Western Michigan | 7.41 | 60 | Akron | 8.00 | 60 | Penn State | 8.15 | 60 | Toledo | 8.24 | 60 | Purdue | 8.20 | ||||
| 61 | Navy | 7.33 | 61 | Navy | 7.95 | 61 | Akron | 8.10 | 61 | Baylor | 8.20 | 61 | Akron | 8.20 | ||||
| 62 | Northern Illinois | 7.31 | 62 | Louisiana-Lafayette | 7.92 | 62 | Navy | 8.08 | 62 | Akron | 8.16 | 62 | Texas | 8.19 | ||||
| 63 | Ohio | 7.18 | 63 | FIU | 7.69 | 63 | Indiana | 8.02 | 63 | Navy | 8.16 | 63 | Oklahoma | 8.13 | ||||
| 64 | Kentucky | 7.14 | 64 | Missouri | 7.67 | 64 | Notre Dame | 7.98 | 64 | Bowling Green | 8.16 | 64 | Bowling Green | 8.12 | ||||
| 65 | Iowa | 7.09 | 65 | Oklahoma State | 7.63 | 65 | Ball State | 7.89 | 65 | Ball State | 8.13 | 65 | Toledo | 8.10 | ||||
| 66 | Houston | 7.08 | 66 | Indiana | 7.61 | 66 | Duke | 7.87 | 66 | Michigan | 8.03 | 66 | Kent State | 7.98 | ||||
| 67 | Rice | 7.01 | 67 | Ball State | 7.53 | 67 | Baylor | 7.82 | 67 | Penn State | 8.00 | 67 | Penn State | 7.91 | ||||
| 68 | Arizona State | 6.80 | 68 | Western Michigan | 7.42 | 68 | Missouri | 7.66 | 68 | Notre Dame | 7.85 | 68 | Illinois | 7.89 | ||||
| 69 | North Texas | 6.73 | 69 | Tulsa | 7.35 | 69 | Oklahoma State | 7.64 | 69 | Kent State | 7.78 | 69 | Tulsa | 7.88 | ||||
| 70 | Utah | 6.38 | 70 | Kansas State | 7.34 | 70 | Tulsa | 7.61 | 70 | Tulsa | 7.78 | 70 | Michigan | 7.83 | ||||
| 71 | Air Force | 6.28 | 71 | Illinois | 7.32 | 71 | Illinois | 7.59 | 71 | Illinois | 7.78 | 71 | Notre Dame | 7.77 | ||||
| 72 | Northwestern | 6.26 | 72 | Michigan State | 7.31 | 72 | Western Kentucky | 7.49 | 72 | Missouri | 7.66 | 72 | Oklahoma State | 7.66 | ||||
| 73 | Louisiana-Monroe | 6.23 | 73 | Wisconsin | 7.29 | 73 | Kent State | 7.45 | 73 | Oklahoma State | 7.65 | 73 | San Diego State | 7.66 | ||||
| 74 | Arkansas State | 6.16 | 74 | Baylor | 7.24 | 74 | Western Michigan | 7.42 | 74 | San Diego State | 7.56 | 74 | Missouri | 7.66 | ||||
| 75 | Boston College | 6.11 | 75 | Northern Illinois | 7.22 | 75 | San Diego State | 7.40 | 75 | Western Michigan | 7.42 | 75 | Eastern Michigan | 7.44 | ||||
| 76 | Tulsa | 6.06 | 76 | San Diego State | 7.16 | 76 | Michigan State | 7.29 | 76 | Michigan State | 7.27 | 76 | Western Michigan | 7.43 | ||||
| 77 | Boise State | 5.99 | 77 | Duke | 7.03 | 77 | Northern Illinois | 7.21 | 77 | Eastern Michigan | 7.26 | 77 | Northwestern | 7.29 | ||||
| 78 | San Diego State | 5.97 | 78 | Northwestern | 6.99 | 78 | Northwestern | 7.14 | 78 | Northwestern | 7.23 | 78 | Michigan State | 7.26 | ||||
| 79 | Illinois | 5.93 | 79 | Kent State | 6.96 | 79 | Kansas State | 7.04 | 79 | Northern Illinois | 7.20 | 79 | Temple | 7.25 | ||||
| 80 | BYU | 5.91 | 80 | Texas Tech | 6.91 | 80 | Eastern Michigan | 6.96 | 80 | Temple | 7.03 | 80 | Northern Illinois | 7.19 | ||||
| 81 | SMU | 5.90 | 81 | Fresno State | 6.89 | 81 | Wisconsin | 6.95 | 81 | Kansas | 6.89 | 81 | Kansas | 6.95 | ||||
| 82 | Kansas | 5.89 | 82 | Nebraska | 6.85 | 82 | Kansas | 6.79 | 82 | Kansas State | 6.85 | 82 | Rutgers | 6.90 | ||||
| 83 | Syracuse | 5.83 | 83 | Iowa | 6.82 | 83 | Iowa | 6.77 | 83 | Rutgers | 6.79 | 83 | Kansas State | 6.73 | ||||
| 84 | Colorado State | 5.79 | 84 | Kansas | 6.64 | 84 | Fresno State | 6.72 | 84 | Iowa | 6.73 | 84 | Iowa | 6.71 | ||||
| 85 | Ball State | 5.71 | 85 | Eastern Michigan | 6.51 | 85 | Texas Tech | 6.71 | 85 | Wisconsin | 6.73 | 85 | Wisconsin | 6.60 | ||||
| 86 | New Mexico | 5.60 | 86 | Arizona State | 6.40 | 86 | Temple | 6.64 | 86 | Fresno State | 6.61 | 86 | Central Michigan | 6.56 | ||||
| 87 | Indiana | 5.59 | 87 | Rutgers | 6.32 | 87 | Rutgers | 6.60 | 87 | Texas Tech | 6.58 | 87 | Fresno State | 6.54 | ||||
| 88 | Colorado | 5.41 | 88 | Western Kentucky | 6.24 | 88 | Nebraska | 6.52 | 88 | Central Michigan | 6.48 | 88 | Texas Tech | 6.50 | ||||
| 89 | Louisiana-Lafayette | 5.31 | 89 | Central Michigan | 6.15 | 89 | Central Michigan | 6.35 | 89 | Nebraska | 6.30 | 89 | UNLV | 6.40 | ||||
| 90 | Iowa State | 5.28 | 90 | Temple | 6.06 | 90 | Arizona State | 6.32 | 90 | Arizona State | 6.27 | 90 | Buffalo | 6.34 | ||||
| 91 | Vanderbilt | 5.23 | 91 | Syracuse | 5.95 | 91 | UNLV | 6.00 | 91 | UNLV | 6.25 | 91 | Arizona State | 6.24 | ||||
| 92 | California | 5.20 | 92 | Iowa State | 5.85 | 92 | Syracuse | 5.97 | 92 | Buffalo | 6.10 | 92 | Army | 6.20 | ||||
| 93 | Central Michigan | 5.18 | 93 | Air Force | 5.70 | 93 | Iowa State | 5.96 | 93 | Iowa State | 6.04 | 93 | Nebraska | 6.17 | ||||
| 94 | Minnesota | 5.17 | 94 | UNLV | 5.63 | 94 | Army | 5.71 | 94 | Army | 6.02 | 94 | Iowa State | 6.08 | ||||
| 95 | Connecticut | 5.13 | 95 | New Mexico | 5.62 | 95 | Buffalo | 5.69 | 95 | Syracuse | 5.99 | 95 | Syracuse | 5.99 | ||||
| 96 | Arizona | 4.96 | 96 | Arizona | 5.47 | 96 | New Mexico | 5.62 | 96 | Arizona | 5.65 | 96 | Arizona | 5.69 | ||||
| 97 | Rutgers | 4.90 | 97 | Utah | 5.40 | 97 | Air Force | 5.59 | 97 | New Mexico | 5.62 | 97 | New Mexico | 5.63 | ||||
| 98 | Oregon | 4.77 | 98 | California | 5.34 | 98 | Arizona | 5.58 | 98 | Air Force | 5.51 | 98 | San Jose State | 5.53 | ||||
| 99 | FIU | 4.70 | 99 | BYU | 5.31 | 99 | California | 5.37 | 99 | San Jose State | 5.44 | 99 | Air Force | 5.46 | ||||
| 100 | Stanford | 4.53 | 100 | Connecticut | 5.30 | 100 | Connecticut | 5.34 | 100 | Stanford | 5.41 | 100 | Stanford | 5.46 | ||||
| 101 | Nevada | 4.49 | 101 | Colorado State | 5.26 | 101 | Stanford | 5.32 | 101 | California | 5.39 | 101 | New Mexico State | 5.45 | ||||
| 102 | Kent State | 4.49 | 102 | Colorado | 5.24 | 102 | San Jose State | 5.30 | 102 | UTEP | 5.38 | 102 | UTEP | 5.45 | ||||
| 103 | Baylor | 4.37 | 103 | Army | 5.24 | 103 | UTEP | 5.27 | 103 | Connecticut | 5.36 | 103 | California | 5.40 | ||||
| 104 | UTEP | 4.30 | 104 | Boston College | 5.21 | 104 | Colorado | 5.21 | 104 | New Mexico State | 5.35 | 104 | Connecticut | 5.37 | ||||
| 105 | Eastern Michigan | 4.27 | 105 | Stanford | 5.18 | 105 | Utah | 5.20 | 105 | Colorado | 5.19 | 105 | Colorado | 5.17 | ||||
| 106 | San Jose State | 4.04 | 106 | UTEP | 5.11 | 106 | BYU | 5.19 | 106 | BYU | 5.11 | 106 | BYU | 5.07 | ||||
| 107 | Oregon State | 3.94 | 107 | San Jose State | 5.09 | 107 | New Mexico State | 5.18 | 107 | Colorado State | 5.08 | 107 | Nevada | 5.06 | ||||
| 108 | Wyoming | 3.89 | 108 | Minnesota | 5.08 | 108 | Colorado State | 5.16 | 108 | Utah | 5.07 | 108 | Colorado State | 5.04 | ||||
| 109 | UNLV | 3.79 | 109 | Buffalo | 5.08 | 109 | Minnesota | 5.06 | 109 | Minnesota | 5.05 | 109 | Minnesota | 5.04 | ||||
| 110 | New Mexico State | 3.68 | 110 | New Mexico State | 4.93 | 110 | Boston College | 5.03 | 110 | Nevada | 5.02 | 110 | Utah | 4.99 | ||||
| 111 | Washington State | 3.33 | 111 | Nevada | 4.89 | 111 | Nevada | 4.97 | 111 | Boston College | 4.91 | 111 | Boston College | 4.84 | ||||
| 112 | Washington | 3.21 | 112 | Boise State | 4.64 | 112 | Wyoming | 4.54 | 112 | Wyoming | 4.61 | 112 | Wyoming | 4.66 | ||||
| 113 | Temple | 3.16 | 113 | Wyoming | 4.43 | 113 | Boise State | 4.37 | 113 | Utah State | 4.36 | 113 | Utah State | 4.45 | ||||
| 114 | Army | 2.88 | 114 | Oregon | 3.96 | 114 | Utah State | 4.20 | 114 | Boise State | 4.19 | 114 | Boise State | 4.08 | ||||
| 115 | Duke | 2.81 | 115 | Utah State | 3.95 | 115 | Oregon | 3.80 | 115 | Oregon | 3.69 | 115 | Oregon | 3.62 | ||||
| 116 | Utah State | 2.75 | 116 | Oregon State | 3.64 | 116 | Oregon State | 3.58 | 116 | Oregon State | 3.54 | 116 | Oregon State | 3.51 | ||||
| 117 | Idaho | 2.20 | 117 | Washington State | 3.28 | 117 | Washington State | 3.26 | 117 | Washington State | 3.26 | 117 | Washington | 3.26 | ||||
| 118 | Buffalo | 1.99 | 118 | Washington | 3.24 | 118 | Washington | 3.25 | 118 | Washington | 3.26 | 118 | Washington State | 3.25 | ||||
| 119 | Hawaii | 1.96 | 119 | Idaho | 2.89 | 119 | Idaho | 3.03 | 119 | Idaho | 3.13 | 119 | Idaho | 3.18 | ||||
| 120 | Western Kentucky | 0.00 | 120 | Hawaii | 1.88 | 120 | Hawaii | 1.86 | 120 | Hawaii | 1.85 | 120 | Hawaii | 1.84 |


Added 12/21/2009