Normalized Probabilities Case 3, Sub-analysis 3: 2006 - 2009 Rivals 250 Lists as Population Source, Scaling Competition by Winning Percentage & Conference Scale Factor = 0
At this point I've actually jumped ahead of my progress on the normalized population models, but I was eager to combine Cases 3-1 and 3-2 with the Rivals 250 recruits and see if the error would drop down any further (and this wouldn't be nearly as interesting for map-making as it is for crunching the numbers). As stated in Case 3-2, you really can't get very far without setting the contributions of the non-Big 6 teams to zero. Furthermore, in this case (and I imagine whenever the conference criteria is used in the future) I've set Notre Dame to fall into the Big 6 category based on their real world results.
Now let's look at the results. The over/under-performers lists focuses on have zero for the winning percentage dilution factor (this yields the most accurate results) in tandem with scaling the non-Big 6 teams to zero. When comparing this to the over/under-performance list from Case 3-1 there is not much change in the overperformers. The shifts in the rankings are due to teams outside the south (e.g. Michigan and Ohio State) who have done very well the last dozen years to now be less "overperforming" while a team like Alabama who hasn't done all that well over the past dozen years (the most recent two seasons are actually a bit anomalous) moves up the rankings because under Nick Saban they've really dominated recruiting.
The underperformer list looks much different, however, and is actually quite interesting. It basically identifies teams that have done well in good recruiting climates but have not yielded returns recruiting. Depending on how you look at it, you could say these teams have overperformed given the talent they've succeeded in attracting or that they've been unsuccessful in parlaying on-the-filed success to recruiting. A look at this list shows how important it will be to factor in a program's prestige (which I plan to later add). The overperformer list is filled with the "old guard" of college football while the underperformer list is filled with upstarts who lack the history of some other programs (often their in-state rivals).
How much am I reducing the error? I was somewhat surprised that this combo didn't help more, but it did reduce the total error (i.e. the sum of the absolute value of the deviations from predicted vs. reality for each school), as seen at the bottom of Table II to 627 from ~720 when winning percentage is not taken into account and only conference ties are.
What will get these numbers closer? As mentioned above, factoring in a program's heritage will surely help given the names at the top of the list. Using the 10-year winning percentage only is a bit simplistic. A blend of 1, 5, and 10 year winning percentages might work better (this would account for the programs at the very top like USC, Florida, Texas who have been particualrly dominant in recent years). It might help to let winning percentage work non-linearly as well--even with a dilution factor of 0, the scaling is only linear. In other words, teams that go undefeated are only about 25% better than teams that go 9-3, but the difference in terms of attracting attention and garnering prestige between a 9-3 and 12-0 record scales more than just 25%. One way to account for this would be to, for instance, square the winning percentage--the gulf goes from 1 - 0.75 = 0.25 to 1^2 - 0.75^2 = 0.4375--a much wider gap between the truly elite teams and teams who are only "pretty good". Such a higher order scaling would probably only have a large impact when only a few seasons are considered because even over only ten seasons very few teams can put together ten dominant seasons (incidentally Boise State has the highest iwnning percentage of any program over the past ten seasons).
The other point to consider is that reducing the error to zero shouldn't really be a goal--the whole point is to find the programs that possess certain intangibles that lead them to recruit better than other teams. In other words to minimize the error using as few factors as possible and then see who under- and overperforms.
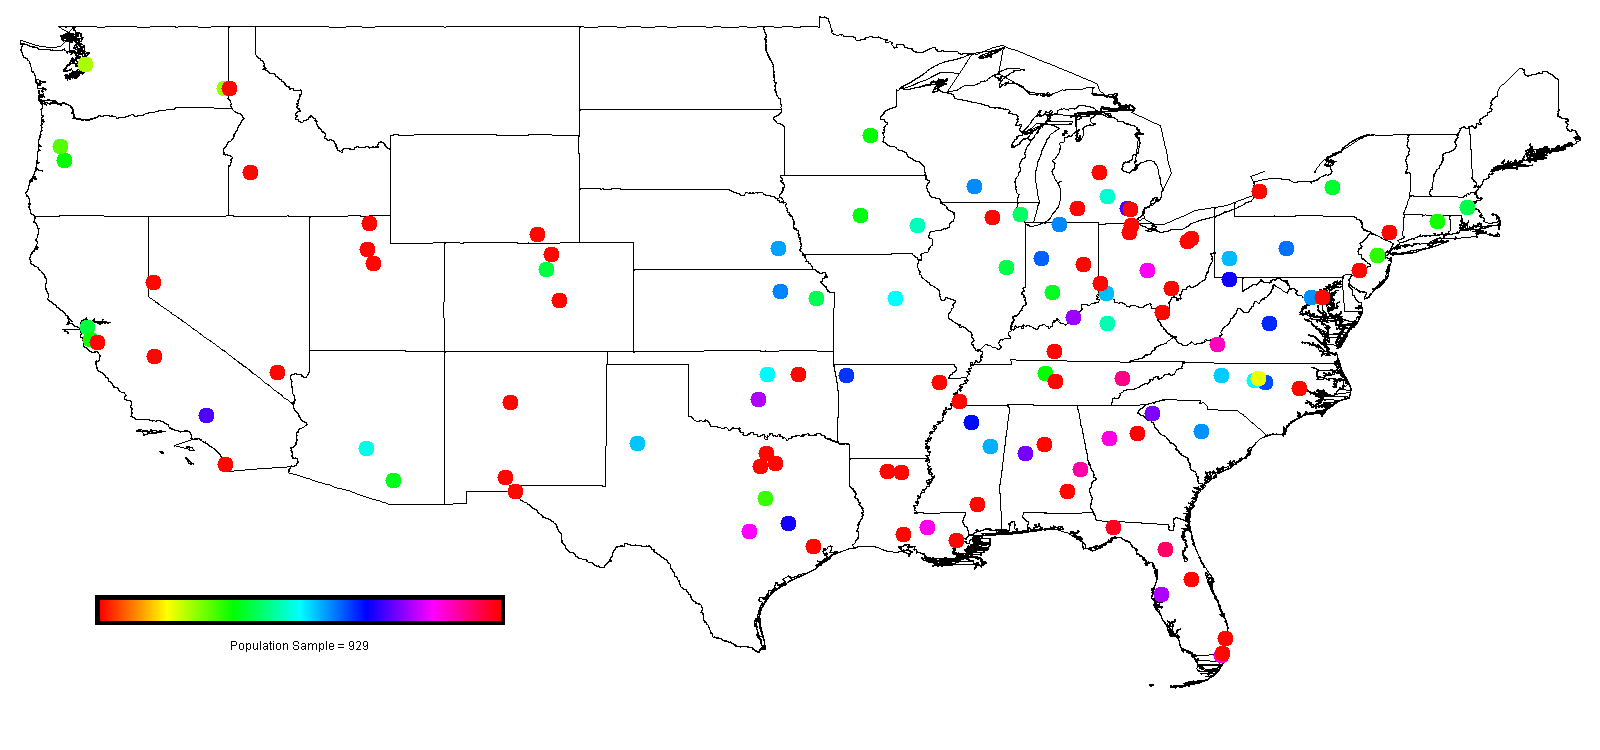
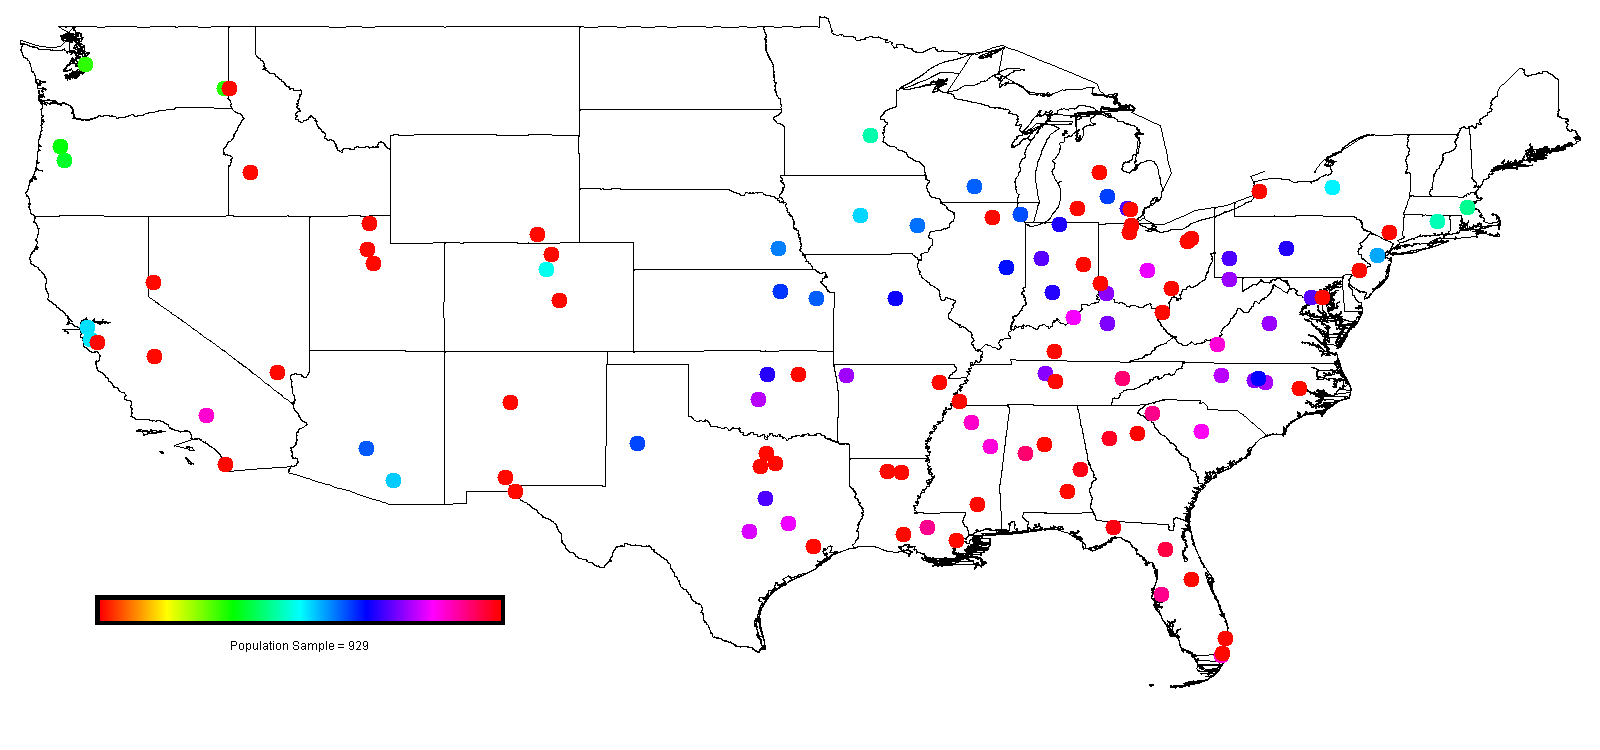
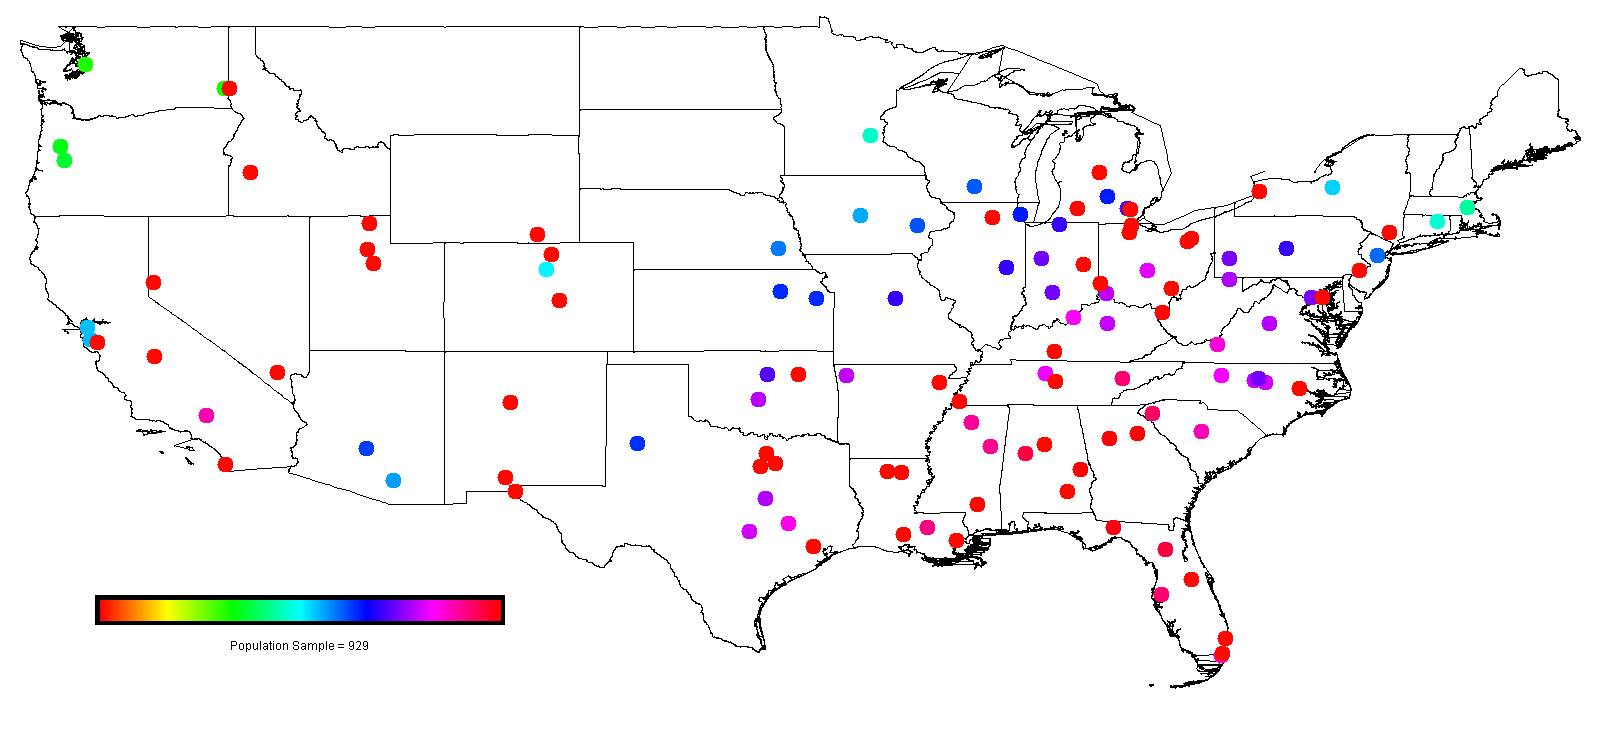
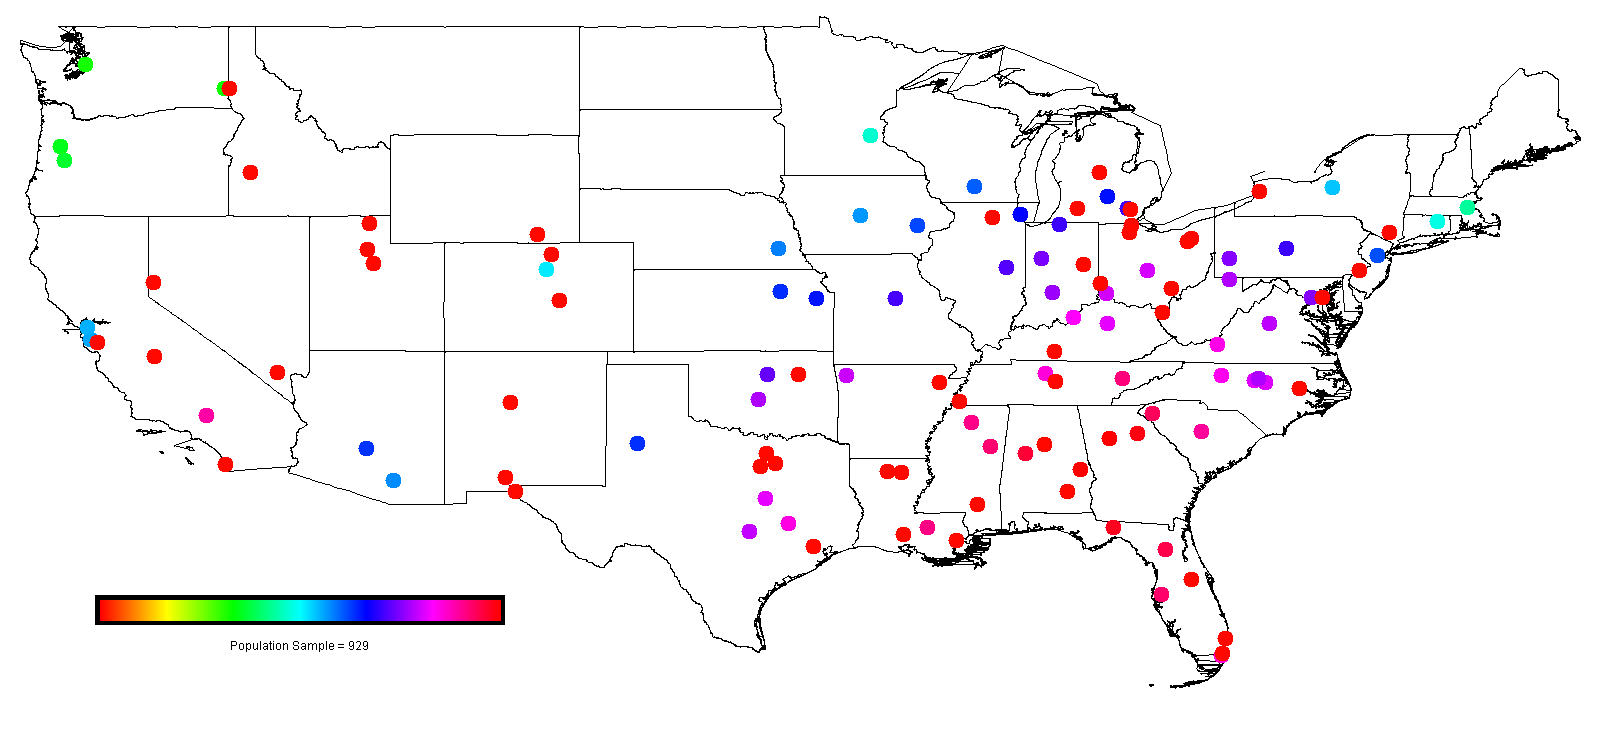
There isn't really much change from before in terms of how many recruits the schools are expected attract. Basically, it's tough being in the north.
A note about the tables. I only included teams in the Big 6 conferences (plus Notre Dame) as all the other teams have expected recruit values of zero for any winning percentage scaling due to the AQ scaling being set to zero.
A note about the images. The circles indicate the number of recruits and location of the 120 schools. They're pretty straightforward except for when non-AQ schools are scaled to zero, then the images don't distinguish "good red" from "bad red". Keeping in mind that the top schools are all in the southeast should help you make sense of it, however.
Table I - Under and Overperformers
| Overperformers | Underperformers | About As Expected | |||||||||||||
| Rank | College | Expected | Actual | Difference | Rank | College | Expected | Actual | Difference | College | Expected | Actual | Difference | ||
| 1 | USC | 21.82 | 53.01 | 31.19 | 1 | South Florida | 19.38 | 2.79 | -16.59 | North Carolina | 12.43 | 16.74 | 4.31 | ||
| 2 | Florida | 23.23 | 52.08 | 28.85 | 2 | Louisville | 19.10 | 2.79 | -16.31 | Oregon | 8.26 | 12.09 | 3.83 | ||
| 3 | Texas | 20.68 | 48.36 | 27.68 | 3 | Purdue | 15.00 | 0.00 | -15.00 | Illinois | 9.38 | 13.02 | 3.64 | ||
| 4 | Notre Dame | 14.37 | 39.99 | 25.62 | 4 | Georgia Tech | 21.17 | 7.44 | -13.73 | South Carolina | 14.17 | 17.67 | 3.50 | ||
| 5 | LSU | 21.03 | 45.57 | 24.54 | 5 | Wake Forest | 13.22 | 0.00 | -13.22 | Pittsburgh | 13.51 | 14.88 | 1.37 | ||
| 6 | Alabama | 18.47 | 39.06 | 20.59 | 6 | Kansas State | 14.41 | 1.86 | -12.55 | Auburn | 22.17 | 23.25 | 1.08 | ||
| 7 | Michigan | 17.90 | 38.13 | 20.23 | 7 | Cincinnati | 13.46 | 0.93 | -12.53 | Washington | 5.47 | 6.51 | 1.04 | ||
| 8 | Ohio State | 20.92 | 39.99 | 19.07 | 8 | West Virginia | 16.80 | 4.65 | -12.15 | Colorado | 9.28 | 10.23 | 0.95 | ||
| 9 | Georgia | 24.87 | 39.99 | 15.12 | 9 | NC State | 15.29 | 3.72 | -11.57 | Arizona | 8.67 | 9.30 | 0.63 | ||
| 10 | Oklahoma | 19.40 | 32.55 | 13.15 | 10 | Virginia Tech | 21.76 | 11.16 | -10.60 | Rutgers | 7.52 | 6.51 | -1.01 | ||
| 11 | Miami | 21.49 | 33.48 | 11.99 | 11 | Texas Tech | 13.31 | 3.72 | -9.59 | Oklahoma State | 12.45 | 11.16 | -1.29 | ||
| 12 | Florida State | 24.30 | 35.34 | 11.04 | 12 | Missouri | 12.37 | 2.79 | -9.58 | Stanford | 8.04 | 6.51 | -1.53 | ||
| 13 | Penn State | 14.68 | 25.11 | 10.43 | 13 | Kentucky | 11.16 | 1.86 | -9.30 | Duke | 4.32 | 2.79 | -1.53 | ||
| 14 | UCLA | 17.82 | 27.90 | 10.08 | 14 | Syracuse | 9.01 | 0.00 | -9.01 | Arizona State | 11.95 | 10.23 | -1.72 | ||
| 15 | Clemson | 18.61 | 26.04 | 7.43 | 15 | Northwestern | 9.88 | 0.93 | -8.95 | Tennessee | 22.67 | 20.46 | -2.21 | ||
| 16 | California | 9.23 | 14.88 | 5.65 | 16 | Indiana | 8.79 | 0.00 | -8.79 | Boston College | 9.44 | 6.51 | -2.93 | ||
| 17 | Kansas | 9.59 | 0.93 | -8.66 | Mississippi State | 13.69 | 10.23 | -3.46 | |||||||
| 18 | Virginia | 15.91 | 7.44 | -8.47 | Oregon State | 6.81 | 2.79 | -4.02 | |||||||
| 19 | Vanderbilt | 8.23 | 0.00 | -8.23 | Minnesota | 8.30 | 3.72 | -4.58 | |||||||
| 20 | Connecticut | 7.91 | 0.00 | -7.91 | Iowa | 11.35 | 6.51 | -4.84 | |||||||
| 21 | Wisconsin | 14.26 | 6.51 | -7.75 | Maryland | 14.21 | 9.30 | -4.91 | |||||||
| 22 | Iowa State | 8.51 | 0.93 | -7.58 | |||||||||||
| 23 | Texas A&M | 16.87 | 9.30 | -7.57 | |||||||||||
| 24 | Ole Miss | 16.38 | 9.30 | -7.08 | |||||||||||
| 25 | Nebraska | 13.89 | 7.44 | -6.45 | |||||||||||
| 26 | Arkansas | 15.70 | 9.30 | -6.40 | |||||||||||
| 27 | Washington State | 5.76 | 0.00 | -5.76 | |||||||||||
| 28 | Baylor | 7.28 | 1.86 | -5.42 | |||||||||||
| 29 | Michigan State | 11.67 | 6.51 | -5.16 | |||||||||||
Table II - Actual vs. Modeled Number of Recruits, Teams Sorted Alphabetically
| College | 0 | 1 | 2 | 4 | 8 | Actual | College | 0 | 1 | 2 | 4 | 8 | Actual | |
| Alabama | 18.47 | 18.50 | 18.50 | 18.51 | 18.51 | 39.06 | NC State | 15.29 | 15.45 | 15.49 | 15.52 | 15.53 | 3.72 | |
| Arizona | 8.67 | 10.27 | 10.62 | 10.86 | 11.00 | 9.30 | Nebraska | 13.89 | 12.01 | 11.60 | 11.32 | 11.16 | 7.44 | |
| Arizona State | 11.95 | 12.06 | 12.09 | 12.11 | 12.12 | 10.23 | North Carolina | 12.43 | 14.59 | 15.07 | 15.39 | 15.59 | 16.74 | |
| Arkansas | 15.70 | 15.43 | 15.37 | 15.33 | 15.31 | 9.30 | Northwestern | 9.88 | 11.83 | 12.26 | 12.55 | 12.72 | 0.93 | |
| Auburn | 22.17 | 20.13 | 19.68 | 19.37 | 19.19 | 23.25 | Notre Dame | 14.37 | 13.79 | 13.66 | 13.57 | 13.52 | 39.99 | |
| Baylor | 7.28 | 13.02 | 14.28 | 15.14 | 15.65 | 1.86 | Ohio State | 20.92 | 17.17 | 16.36 | 15.80 | 15.47 | 39.99 | |
| Boston College | 9.44 | 8.66 | 8.49 | 8.37 | 8.30 | 6.51 | Oklahoma | 19.40 | 16.35 | 15.69 | 15.23 | 14.96 | 32.55 | |
| California | 9.23 | 10.12 | 10.32 | 10.45 | 10.53 | 14.88 | Oklahoma State | 12.45 | 13.54 | 13.77 | 13.94 | 14.03 | 11.16 | |
| Cincinnati | 13.46 | 14.80 | 15.10 | 15.30 | 15.42 | 0.93 | Ole Miss | 16.38 | 17.14 | 17.31 | 17.42 | 17.49 | 9.30 | |
| Clemson | 18.61 | 18.24 | 18.16 | 18.10 | 18.07 | 26.04 | Oregon | 8.26 | 7.32 | 7.12 | 6.98 | 6.90 | 12.09 | |
| Colorado | 9.28 | 9.64 | 9.72 | 9.77 | 9.80 | 10.23 | Oregon State | 6.81 | 6.71 | 6.69 | 6.67 | 6.66 | 2.79 | |
| Connecticut | 7.91 | 8.80 | 8.99 | 9.12 | 9.20 | 0.00 | Penn State | 14.68 | 13.88 | 13.71 | 13.59 | 13.52 | 25.11 | |
| Duke | 4.32 | 11.63 | 13.22 | 14.32 | 14.97 | 2.79 | Pittsburgh | 13.51 | 14.15 | 14.29 | 14.39 | 14.45 | 14.88 | |
| Florida | 23.23 | 19.84 | 19.09 | 18.58 | 18.27 | 52.08 | Purdue | 15.00 | 14.52 | 14.41 | 14.34 | 14.30 | 0.00 | |
| Florida State | 24.30 | 20.54 | 19.71 | 19.15 | 18.81 | 35.34 | Rutgers | 7.52 | 10.44 | 11.08 | 11.51 | 11.77 | 6.51 | |
| Georgia | 24.87 | 20.85 | 19.96 | 19.36 | 18.99 | 39.99 | South Carolina | 14.17 | 16.28 | 16.75 | 17.07 | 17.26 | 17.67 | |
| Georgia Tech | 21.17 | 19.82 | 19.52 | 19.32 | 19.20 | 7.44 | South Florida | 19.38 | 18.34 | 18.11 | 17.95 | 17.86 | 2.79 | |
| Illinois | 9.38 | 12.42 | 13.09 | 13.54 | 13.81 | 13.02 | Stanford | 8.04 | 9.84 | 10.23 | 10.50 | 10.66 | 6.51 | |
| Indiana | 8.79 | 12.86 | 13.75 | 14.36 | 14.72 | 0.00 | Syracuse | 9.01 | 9.88 | 10.07 | 10.20 | 10.28 | 0.00 | |
| Iowa | 11.35 | 11.71 | 11.79 | 11.84 | 11.87 | 6.51 | Tennessee | 22.67 | 19.22 | 18.47 | 17.95 | 17.65 | 20.46 | |
| Iowa State | 8.51 | 10.12 | 10.47 | 10.71 | 10.85 | 0.93 | Texas | 20.68 | 16.94 | 16.13 | 15.57 | 15.23 | 48.36 | |
| Kansas | 9.59 | 11.61 | 12.06 | 12.36 | 12.54 | 0.93 | Texas A&M | 16.87 | 16.50 | 16.42 | 16.37 | 16.33 | 9.30 | |
| Kansas State | 14.41 | 12.91 | 12.58 | 12.36 | 12.22 | 1.86 | Texas Tech | 13.31 | 12.54 | 12.37 | 12.25 | 12.18 | 3.72 | |
| Kentucky | 11.16 | 14.25 | 14.93 | 15.39 | 15.67 | 1.86 | UCLA | 17.82 | 17.34 | 17.24 | 17.16 | 17.12 | 27.90 | |
| Louisville | 19.10 | 16.98 | 16.52 | 16.21 | 16.02 | 2.79 | USC | 21.82 | 18.78 | 18.11 | 17.66 | 17.38 | 53.01 | |
| LSU | 21.03 | 18.63 | 18.10 | 17.74 | 17.52 | 45.57 | Vanderbilt | 8.23 | 13.86 | 15.09 | 15.93 | 16.44 | 0.00 | |
| Maryland | 14.21 | 14.38 | 14.42 | 14.44 | 14.46 | 9.30 | Virginia | 15.91 | 15.40 | 15.29 | 15.21 | 15.17 | 7.44 | |
| Miami | 21.49 | 18.12 | 17.37 | 16.86 | 16.55 | 33.48 | Virginia Tech | 21.76 | 17.98 | 17.15 | 16.59 | 16.25 | 11.16 | |
| Michigan | 17.90 | 14.92 | 14.28 | 13.84 | 13.57 | 38.13 | Wake Forest | 13.22 | 15.25 | 15.69 | 16.00 | 16.18 | 0.00 | |
| Michigan State | 11.67 | 12.30 | 12.44 | 12.54 | 12.59 | 6.51 | Washington | 5.47 | 5.89 | 5.99 | 6.05 | 6.09 | 6.51 | |
| Minnesota | 8.30 | 8.75 | 8.85 | 8.92 | 8.96 | 3.72 | Washington State | 5.76 | 6.05 | 6.11 | 6.15 | 6.18 | 0.00 | |
| Mississippi State | 13.69 | 16.49 | 17.10 | 17.52 | 17.77 | 10.23 | West Virginia | 16.80 | 15.55 | 15.28 | 15.09 | 14.98 | 4.65 | |
| Missouri | 12.37 | 13.25 | 13.44 | 13.57 | 13.65 | 2.79 | Wisconsin | 14.26 | 12.42 | 12.02 | 11.74 | 11.58 | 6.51 | |
| Total Deviation from Actual | 627.32 | 686.63 | 701.02 | 711.70 | 718.09 | |||||||||
Table III - Recruiting Ranking, Actual vs. Modeled, Teams Sorted Alphabetically
| College | 0 | 1 | 2 | 4 | 8 | Actual | College | 0 | 1 | 2 | 4 | 8 | Actual | |
| Alabama | 17 | 9 | 6 | 6 | 5 | 8 | NC State | 25 | 24 | 24 | 24 | 25 | 46 | |
| Arizona | 54 | 54 | 54 | 54 | 54 | 29 | Nebraska | 33 | 48 | 52 | 53 | 53 | 35 | |
| Arizona State | 42 | 47 | 48 | 49 | 49 | 26 | North Carolina | 40 | 30 | 30 | 25 | 24 | 19 | |
| Arkansas | 24 | 25 | 25 | 27 | 28 | 30 | Northwestern | 46 | 49 | 47 | 44 | 44 | 62 | |
| Auburn | 5 | 3 | 3 | 1 | 2 | 16 | Notre Dame | 29 | 37 | 40 | 41 | 42 | 6 | |
| Baylor | 62 | 40 | 35 | 31 | 23 | 53 | Ohio State | 11 | 15 | 20 | 22 | 26 | 7 | |
| Boston College | 48 | 62 | 62 | 62 | 62 | 37 | Oklahoma | 13 | 21 | 23 | 29 | 33 | 12 | |
| California | 51 | 55 | 56 | 57 | 57 | 20 | Oklahoma State | 39 | 38 | 37 | 38 | 38 | 24 | |
| Cincinnati | 36 | 29 | 28 | 28 | 27 | 58 | Ole Miss | 22 | 16 | 13 | 13 | 12 | 32 | |
| Clemson | 16 | 11 | 8 | 7 | 7 | 14 | Oregon | 57 | 63 | 63 | 63 | 63 | 23 | |
| Colorado | 50 | 59 | 59 | 59 | 59 | 27 | Oregon State | 63 | 64 | 64 | 64 | 64 | 51 | |
| Connecticut | 60 | 60 | 60 | 60 | 60 | 68 | Penn State | 27 | 35 | 39 | 40 | 43 | 15 | |
| Duke | 66 | 51 | 42 | 37 | 32 | 48 | Pittsburgh | 35 | 34 | 34 | 34 | 36 | 21 | |
| Florida | 3 | 4 | 5 | 5 | 6 | 2 | Purdue | 26 | 31 | 33 | 36 | 37 | 68 | |
| Florida State | 2 | 2 | 2 | 4 | 4 | 10 | Rutgers | 61 | 53 | 53 | 52 | 51 | 40 | |
| Georgia | 1 | 1 | 1 | 2 | 3 | 5 | South Carolina | 32 | 22 | 17 | 15 | 14 | 18 | |
| Georgia Tech | 9 | 5 | 4 | 3 | 1 | 34 | South Florida | 14 | 10 | 10 | 9 | 8 | 52 | |
| Illinois | 49 | 44 | 43 | 43 | 39 | 22 | Stanford | 59 | 58 | 57 | 56 | 56 | 41 | |
| Indiana | 53 | 42 | 38 | 35 | 34 | 68 | Syracuse | 52 | 57 | 58 | 58 | 58 | 68 | |
| Iowa | 44 | 50 | 51 | 50 | 50 | 38 | Tennessee | 4 | 6 | 7 | 8 | 10 | 17 | |
| Iowa State | 55 | 56 | 55 | 55 | 55 | 60 | Texas | 12 | 18 | 21 | 23 | 29 | 3 | |
| Kansas | 47 | 52 | 49 | 46 | 46 | 61 | Texas A&M | 20 | 19 | 19 | 18 | 18 | 33 | |
| Kansas State | 28 | 41 | 44 | 47 | 47 | 54 | Texas Tech | 37 | 43 | 46 | 48 | 48 | 47 | |
| Kentucky | 45 | 33 | 31 | 26 | 22 | 55 | UCLA | 19 | 14 | 14 | 14 | 15 | 13 | |
| Louisville | 15 | 17 | 18 | 19 | 21 | 49 | USC | 6 | 7 | 9 | 11 | 13 | 1 | |
| LSU | 10 | 8 | 11 | 10 | 11 | 4 | Vanderbilt | 58 | 36 | 29 | 21 | 17 | 68 | |
| Maryland | 31 | 32 | 32 | 33 | 35 | 31 | Virginia | 23 | 26 | 26 | 30 | 30 | 36 | |
| Miami | 8 | 12 | 12 | 16 | 16 | 11 | Virginia Tech | 7 | 13 | 15 | 17 | 19 | 25 | |
| Michigan | 18 | 28 | 36 | 39 | 41 | 9 | Wake Forest | 38 | 27 | 22 | 20 | 20 | 68 | |
| Michigan State | 43 | 46 | 45 | 45 | 45 | 39 | Washington | 65 | 66 | 66 | 66 | 66 | 42 | |
| Minnesota | 56 | 61 | 61 | 61 | 61 | 45 | Washington State | 64 | 65 | 65 | 65 | 65 | 68 | |
| Mississippi State | 34 | 20 | 16 | 12 | 9 | 28 | West Virginia | 21 | 23 | 27 | 32 | 31 | 44 | |
| Missouri | 41 | 39 | 41 | 42 | 40 | 50 | Wisconsin | 30 | 45 | 50 | 51 | 52 | 43 |
Table IV - Rankings for Each Scale Factor
| Dilution Factor = 0.0 | Dilution Factor = 1.0 | Dilution Factor = 2.0 | Dilution Factor = 4.0 | Dilution Factor = 8.0 | ||||||||||||||
| Rank | College | Recruits | Rank | College | Recruits | Rank | College | Recruits | Rank | College | Recruits | Rank | College | Recruits | ||||
| 1 | Georgia | 24.87 | 1 | Georgia | 20.85 | 1 | Georgia | 19.96 | 1 | Auburn | 19.37 | 1 | Georgia Tech | 19.20 | ||||
| 2 | Florida State | 24.30 | 2 | Florida State | 20.54 | 2 | Florida State | 19.71 | 2 | Georgia | 19.36 | 2 | Auburn | 19.19 | ||||
| 3 | Florida | 23.23 | 3 | Auburn | 20.13 | 3 | Auburn | 19.68 | 3 | Georgia Tech | 19.32 | 3 | Georgia | 18.99 | ||||
| 4 | Tennessee | 22.67 | 4 | Florida | 19.84 | 4 | Georgia Tech | 19.52 | 4 | Florida State | 19.15 | 4 | Florida State | 18.81 | ||||
| 5 | Auburn | 22.17 | 5 | Georgia Tech | 19.82 | 5 | Florida | 19.09 | 5 | Florida | 18.58 | 5 | Alabama | 18.51 | ||||
| 6 | USC | 21.82 | 6 | Tennessee | 19.22 | 6 | Alabama | 18.50 | 6 | Alabama | 18.51 | 6 | Florida | 18.27 | ||||
| 7 | Virginia Tech | 21.76 | 7 | USC | 18.78 | 7 | Tennessee | 18.47 | 7 | Clemson | 18.10 | 7 | Clemson | 18.07 | ||||
| 8 | Miami | 21.49 | 8 | LSU | 18.63 | 8 | Clemson | 18.16 | 8 | Tennessee | 17.95 | 8 | South Florida | 17.86 | ||||
| 9 | Georgia Tech | 21.17 | 9 | Alabama | 18.50 | 9 | USC | 18.11 | 9 | South Florida | 17.95 | 9 | Mississippi State | 17.77 | ||||
| 10 | LSU | 21.03 | 10 | South Florida | 18.34 | 10 | South Florida | 18.11 | 10 | LSU | 17.74 | 10 | Tennessee | 17.65 | ||||
| 11 | Ohio State | 20.92 | 11 | Clemson | 18.24 | 11 | LSU | 18.10 | 11 | USC | 17.66 | 11 | LSU | 17.52 | ||||
| 12 | Texas | 20.68 | 12 | Miami | 18.12 | 12 | Miami | 17.37 | 12 | Mississippi State | 17.52 | 12 | Ole Miss | 17.49 | ||||
| 13 | Oklahoma | 19.40 | 13 | Virginia Tech | 17.98 | 13 | Ole Miss | 17.31 | 13 | Ole Miss | 17.42 | 13 | USC | 17.38 | ||||
| 14 | South Florida | 19.38 | 14 | UCLA | 17.34 | 14 | UCLA | 17.24 | 14 | UCLA | 17.16 | 14 | South Carolina | 17.26 | ||||
| 15 | Louisville | 19.10 | 15 | Ohio State | 17.17 | 15 | Virginia Tech | 17.15 | 15 | South Carolina | 17.07 | 15 | UCLA | 17.12 | ||||
| 16 | Clemson | 18.61 | 16 | Ole Miss | 17.14 | 16 | Mississippi State | 17.10 | 16 | Miami | 16.86 | 16 | Miami | 16.55 | ||||
| 17 | Alabama | 18.47 | 17 | Louisville | 16.98 | 17 | South Carolina | 16.75 | 17 | Virginia Tech | 16.59 | 17 | Vanderbilt | 16.44 | ||||
| 18 | Michigan | 17.90 | 18 | Texas | 16.94 | 18 | Louisville | 16.52 | 18 | Texas A&M | 16.37 | 18 | Texas A&M | 16.33 | ||||
| 19 | UCLA | 17.82 | 19 | Texas A&M | 16.50 | 19 | Texas A&M | 16.42 | 19 | Louisville | 16.21 | 19 | Virginia Tech | 16.25 | ||||
| 20 | Texas A&M | 16.87 | 20 | Mississippi State | 16.49 | 20 | Ohio State | 16.36 | 20 | Wake Forest | 16.00 | 20 | Wake Forest | 16.18 | ||||
| 21 | West Virginia | 16.80 | 21 | Oklahoma | 16.35 | 21 | Texas | 16.13 | 21 | Vanderbilt | 15.93 | 21 | Louisville | 16.02 | ||||
| 22 | Ole Miss | 16.38 | 22 | South Carolina | 16.28 | 22 | Wake Forest | 15.69 | 22 | Ohio State | 15.80 | 22 | Kentucky | 15.67 | ||||
| 23 | Virginia | 15.91 | 23 | West Virginia | 15.55 | 23 | Oklahoma | 15.69 | 23 | Texas | 15.57 | 23 | Baylor | 15.65 | ||||
| 24 | Arkansas | 15.70 | 24 | NC State | 15.45 | 24 | NC State | 15.49 | 24 | NC State | 15.52 | 24 | North Carolina | 15.59 | ||||
| 25 | NC State | 15.29 | 25 | Arkansas | 15.43 | 25 | Arkansas | 15.37 | 25 | North Carolina | 15.39 | 25 | NC State | 15.53 | ||||
| 26 | Purdue | 15.00 | 26 | Virginia | 15.40 | 26 | Virginia | 15.29 | 26 | Kentucky | 15.39 | 26 | Ohio State | 15.47 | ||||
| 27 | Penn State | 14.68 | 27 | Wake Forest | 15.25 | 27 | West Virginia | 15.28 | 27 | Arkansas | 15.33 | 27 | Cincinnati | 15.42 | ||||
| 28 | Kansas State | 14.41 | 28 | Michigan | 14.92 | 28 | Cincinnati | 15.10 | 28 | Cincinnati | 15.30 | 28 | Arkansas | 15.31 | ||||
| 29 | Notre Dame | 14.37 | 29 | Cincinnati | 14.80 | 29 | Vanderbilt | 15.09 | 29 | Oklahoma | 15.23 | 29 | Texas | 15.23 | ||||
| 30 | Wisconsin | 14.26 | 30 | North Carolina | 14.59 | 30 | North Carolina | 15.07 | 30 | Virginia | 15.21 | 30 | Virginia | 15.17 | ||||
| 31 | Maryland | 14.21 | 31 | Purdue | 14.52 | 31 | Kentucky | 14.93 | 31 | Baylor | 15.14 | 31 | West Virginia | 14.98 | ||||
| 32 | South Carolina | 14.17 | 32 | Maryland | 14.38 | 32 | Maryland | 14.42 | 32 | West Virginia | 15.09 | 32 | Duke | 14.97 | ||||
| 33 | Nebraska | 13.89 | 33 | Kentucky | 14.25 | 33 | Purdue | 14.41 | 33 | Maryland | 14.44 | 33 | Oklahoma | 14.96 | ||||
| 34 | Mississippi State | 13.69 | 34 | Pittsburgh | 14.15 | 34 | Pittsburgh | 14.29 | 34 | Pittsburgh | 14.39 | 34 | Indiana | 14.72 | ||||
| 35 | Pittsburgh | 13.51 | 35 | Penn State | 13.88 | 35 | Baylor | 14.28 | 35 | Indiana | 14.36 | 35 | Maryland | 14.46 | ||||
| 36 | Cincinnati | 13.46 | 36 | Vanderbilt | 13.86 | 36 | Michigan | 14.28 | 36 | Purdue | 14.34 | 36 | Pittsburgh | 14.45 | ||||
| 37 | Texas Tech | 13.31 | 37 | Notre Dame | 13.79 | 37 | Oklahoma State | 13.77 | 37 | Duke | 14.32 | 37 | Purdue | 14.30 | ||||
| 38 | Wake Forest | 13.22 | 38 | Oklahoma State | 13.54 | 38 | Indiana | 13.75 | 38 | Oklahoma State | 13.94 | 38 | Oklahoma State | 14.03 | ||||
| 39 | Oklahoma State | 12.45 | 39 | Missouri | 13.25 | 39 | Penn State | 13.71 | 39 | Michigan | 13.84 | 39 | Illinois | 13.81 | ||||
| 40 | North Carolina | 12.43 | 40 | Baylor | 13.02 | 40 | Notre Dame | 13.66 | 40 | Penn State | 13.59 | 40 | Missouri | 13.65 | ||||
| 41 | Missouri | 12.37 | 41 | Kansas State | 12.91 | 41 | Missouri | 13.44 | 41 | Notre Dame | 13.57 | 41 | Michigan | 13.57 | ||||
| 42 | Arizona State | 11.95 | 42 | Indiana | 12.86 | 42 | Duke | 13.22 | 42 | Missouri | 13.57 | 42 | Notre Dame | 13.52 | ||||
| 43 | Michigan State | 11.67 | 43 | Texas Tech | 12.54 | 43 | Illinois | 13.09 | 43 | Illinois | 13.54 | 43 | Penn State | 13.52 | ||||
| 44 | Iowa | 11.35 | 44 | Illinois | 12.42 | 44 | Kansas State | 12.58 | 44 | Northwestern | 12.55 | 44 | Northwestern | 12.72 | ||||
| 45 | Kentucky | 11.16 | 45 | Wisconsin | 12.42 | 45 | Michigan State | 12.44 | 45 | Michigan State | 12.54 | 45 | Michigan State | 12.59 | ||||
| 46 | Northwestern | 9.88 | 46 | Michigan State | 12.30 | 46 | Texas Tech | 12.37 | 46 | Kansas | 12.36 | 46 | Kansas | 12.54 | ||||
| 47 | Kansas | 9.59 | 47 | Arizona State | 12.06 | 47 | Northwestern | 12.26 | 47 | Kansas State | 12.36 | 47 | Kansas State | 12.22 | ||||
| 48 | Boston College | 9.44 | 48 | Nebraska | 12.01 | 48 | Arizona State | 12.09 | 48 | Texas Tech | 12.25 | 48 | Texas Tech | 12.18 | ||||
| 49 | Illinois | 9.38 | 49 | Northwestern | 11.83 | 49 | Kansas | 12.06 | 49 | Arizona State | 12.11 | 49 | Arizona State | 12.12 | ||||
| 50 | Colorado | 9.28 | 50 | Iowa | 11.71 | 50 | Wisconsin | 12.02 | 50 | Iowa | 11.84 | 50 | Iowa | 11.87 | ||||
| 51 | California | 9.23 | 51 | Duke | 11.63 | 51 | Iowa | 11.79 | 51 | Wisconsin | 11.74 | 51 | Rutgers | 11.77 | ||||
| 52 | Syracuse | 9.01 | 52 | Kansas | 11.61 | 52 | Nebraska | 11.60 | 52 | Rutgers | 11.51 | 52 | Wisconsin | 11.58 | ||||
| 53 | Indiana | 8.79 | 53 | Rutgers | 10.44 | 53 | Rutgers | 11.08 | 53 | Nebraska | 11.32 | 53 | Nebraska | 11.16 | ||||
| 54 | Arizona | 8.67 | 54 | Arizona | 10.27 | 54 | Arizona | 10.62 | 54 | Arizona | 10.86 | 54 | Arizona | 11.00 | ||||
| 55 | Iowa State | 8.51 | 55 | California | 10.12 | 55 | Iowa State | 10.47 | 55 | Iowa State | 10.71 | 55 | Iowa State | 10.85 | ||||
| 56 | Minnesota | 8.30 | 56 | Iowa State | 10.12 | 56 | California | 10.32 | 56 | Stanford | 10.50 | 56 | Stanford | 10.66 | ||||
| 57 | Oregon | 8.26 | 57 | Syracuse | 9.88 | 57 | Stanford | 10.23 | 57 | California | 10.45 | 57 | California | 10.53 | ||||
| 58 | Vanderbilt | 8.23 | 58 | Stanford | 9.84 | 58 | Syracuse | 10.07 | 58 | Syracuse | 10.20 | 58 | Syracuse | 10.28 | ||||
| 59 | Stanford | 8.04 | 59 | Colorado | 9.64 | 59 | Colorado | 9.72 | 59 | Colorado | 9.77 | 59 | Colorado | 9.80 | ||||
| 60 | Connecticut | 7.91 | 60 | Connecticut | 8.80 | 60 | Connecticut | 8.99 | 60 | Connecticut | 9.12 | 60 | Connecticut | 9.20 | ||||
| 61 | Rutgers | 7.52 | 61 | Minnesota | 8.75 | 61 | Minnesota | 8.85 | 61 | Minnesota | 8.92 | 61 | Minnesota | 8.96 | ||||
| 62 | Baylor | 7.28 | 62 | Boston College | 8.66 | 62 | Boston College | 8.49 | 62 | Boston College | 8.37 | 62 | Boston College | 8.30 | ||||
| 63 | Oregon State | 6.81 | 63 | Oregon | 7.32 | 63 | Oregon | 7.12 | 63 | Oregon | 6.98 | 63 | Oregon | 6.90 | ||||
| 64 | Washington State | 5.76 | 64 | Oregon State | 6.71 | 64 | Oregon State | 6.69 | 64 | Oregon State | 6.67 | 64 | Oregon State | 6.66 | ||||
| 65 | Washington | 5.47 | 65 | Washington State | 6.05 | 65 | Washington State | 6.11 | 65 | Washington State | 6.15 | 65 | Washington State | 6.18 | ||||
| 66 | Duke | 4.32 | 66 | Washington | 5.89 | 66 | Washington | 5.99 | 66 | Washington | 6.05 | 66 | Washington | 6.09 | ||||
| 67 | Air Force | 0.00 | 67 | Air Force | 0.00 | 67 | Air Force | 0.00 | 67 | Air Force | 0.00 | 67 | Air Force | 0.00 | ||||
| 68 | Akron | 0.00 | 68 | Akron | 0.00 | 68 | Akron | 0.00 | 68 | Akron | 0.00 | 68 | Akron | 0.00 | ||||
| 69 | Arkansas State | 0.00 | 69 | Arkansas State | 0.00 | 69 | Arkansas State | 0.00 | 69 | Arkansas State | 0.00 | 69 | Arkansas State | 0.00 | ||||
| 70 | Army | 0.00 | 70 | Army | 0.00 | 70 | Army | 0.00 | 70 | Army | 0.00 | 70 | Army | 0.00 | ||||
| 71 | Ball State | 0.00 | 71 | Ball State | 0.00 | 71 | Ball State | 0.00 | 71 | Ball State | 0.00 | 71 | Ball State | 0.00 | ||||
| 72 | Boise State | 0.00 | 72 | Boise State | 0.00 | 72 | Boise State | 0.00 | 72 | Boise State | 0.00 | 72 | Boise State | 0.00 | ||||
| 73 | Bowling Green | 0.00 | 73 | Bowling Green | 0.00 | 73 | Bowling Green | 0.00 | 73 | Bowling Green | 0.00 | 73 | Bowling Green | 0.00 | ||||
| 74 | Buffalo | 0.00 | 74 | Buffalo | 0.00 | 74 | Buffalo | 0.00 | 74 | Buffalo | 0.00 | 74 | Buffalo | 0.00 | ||||
| 75 | BYU | 0.00 | 75 | BYU | 0.00 | 75 | BYU | 0.00 | 75 | BYU | 0.00 | 75 | BYU | 0.00 | ||||
| 76 | Central Michigan | 0.00 | 76 | Central Michigan | 0.00 | 76 | Central Michigan | 0.00 | 76 | Central Michigan | 0.00 | 76 | Central Michigan | 0.00 | ||||
| 77 | Colorado State | 0.00 | 77 | Colorado State | 0.00 | 77 | Colorado State | 0.00 | 77 | Colorado State | 0.00 | 77 | Colorado State | 0.00 | ||||
| 78 | Eastern Michigan | 0.00 | 78 | Eastern Michigan | 0.00 | 78 | Eastern Michigan | 0.00 | 78 | Eastern Michigan | 0.00 | 78 | Eastern Michigan | 0.00 | ||||
| 79 | ECU | 0.00 | 79 | ECU | 0.00 | 79 | ECU | 0.00 | 79 | ECU | 0.00 | 79 | ECU | 0.00 | ||||
| 80 | FIU | 0.00 | 80 | FIU | 0.00 | 80 | FIU | 0.00 | 80 | FIU | 0.00 | 80 | FIU | 0.00 | ||||
| 81 | Florida Atlantic | 0.00 | 81 | Florida Atlantic | 0.00 | 81 | Florida Atlantic | 0.00 | 81 | Florida Atlantic | 0.00 | 81 | Florida Atlantic | 0.00 | ||||
| 82 | Fresno State | 0.00 | 82 | Fresno State | 0.00 | 82 | Fresno State | 0.00 | 82 | Fresno State | 0.00 | 82 | Fresno State | 0.00 | ||||
| 83 | Hawaii | 0.00 | 83 | Hawaii | 0.00 | 83 | Hawaii | 0.00 | 83 | Hawaii | 0.00 | 83 | Hawaii | 0.00 | ||||
| 84 | Houston | 0.00 | 84 | Houston | 0.00 | 84 | Houston | 0.00 | 84 | Houston | 0.00 | 84 | Houston | 0.00 | ||||
| 85 | Idaho | 0.00 | 85 | Idaho | 0.00 | 85 | Idaho | 0.00 | 85 | Idaho | 0.00 | 85 | Idaho | 0.00 | ||||
| 86 | Kent State | 0.00 | 86 | Kent State | 0.00 | 86 | Kent State | 0.00 | 86 | Kent State | 0.00 | 86 | Kent State | 0.00 | ||||
| 87 | Louisiana Tech | 0.00 | 87 | Louisiana Tech | 0.00 | 87 | Louisiana Tech | 0.00 | 87 | Louisiana Tech | 0.00 | 87 | Louisiana Tech | 0.00 | ||||
| 88 | Louisiana-Lafayette | 0.00 | 88 | Louisiana-Lafayette | 0.00 | 88 | Louisiana-Lafayette | 0.00 | 88 | Louisiana-Lafayette | 0.00 | 88 | Louisiana-Lafayette | 0.00 | ||||
| 89 | Louisiana-Monroe | 0.00 | 89 | Louisiana-Monroe | 0.00 | 89 | Louisiana-Monroe | 0.00 | 89 | Louisiana-Monroe | 0.00 | 89 | Louisiana-Monroe | 0.00 | ||||
| 90 | Marshall | 0.00 | 90 | Marshall | 0.00 | 90 | Marshall | 0.00 | 90 | Marshall | 0.00 | 90 | Marshall | 0.00 | ||||
| 91 | Memphis | 0.00 | 91 | Memphis | 0.00 | 91 | Memphis | 0.00 | 91 | Memphis | 0.00 | 91 | Memphis | 0.00 | ||||
| 92 | Miami (OH) | 0.00 | 92 | Miami (OH) | 0.00 | 92 | Miami (OH) | 0.00 | 92 | Miami (OH) | 0.00 | 92 | Miami (OH) | 0.00 | ||||
| 93 | Middle Tennessee | 0.00 | 93 | Middle Tennessee | 0.00 | 93 | Middle Tennessee | 0.00 | 93 | Middle Tennessee | 0.00 | 93 | Middle Tennessee | 0.00 | ||||
| 94 | Navy | 0.00 | 94 | Navy | 0.00 | 94 | Navy | 0.00 | 94 | Navy | 0.00 | 94 | Navy | 0.00 | ||||
| 95 | Nevada | 0.00 | 95 | Nevada | 0.00 | 95 | Nevada | 0.00 | 95 | Nevada | 0.00 | 95 | Nevada | 0.00 | ||||
| 96 | New Mexico | 0.00 | 96 | New Mexico | 0.00 | 96 | New Mexico | 0.00 | 96 | New Mexico | 0.00 | 96 | New Mexico | 0.00 | ||||
| 97 | New Mexico State | 0.00 | 97 | New Mexico State | 0.00 | 97 | New Mexico State | 0.00 | 97 | New Mexico State | 0.00 | 97 | New Mexico State | 0.00 | ||||
| 98 | North Texas | 0.00 | 98 | North Texas | 0.00 | 98 | North Texas | 0.00 | 98 | North Texas | 0.00 | 98 | North Texas | 0.00 | ||||
| 99 | Northern Illinois | 0.00 | 99 | Northern Illinois | 0.00 | 99 | Northern Illinois | 0.00 | 99 | Northern Illinois | 0.00 | 99 | Northern Illinois | 0.00 | ||||
| 100 | Ohio | 0.00 | 100 | Ohio | 0.00 | 100 | Ohio | 0.00 | 100 | Ohio | 0.00 | 100 | Ohio | 0.00 | ||||
| 101 | Rice | 0.00 | 101 | Rice | 0.00 | 101 | Rice | 0.00 | 101 | Rice | 0.00 | 101 | Rice | 0.00 | ||||
| 102 | San Diego State | 0.00 | 102 | San Diego State | 0.00 | 102 | San Diego State | 0.00 | 102 | San Diego State | 0.00 | 102 | San Diego State | 0.00 | ||||
| 103 | San Jose State | 0.00 | 103 | San Jose State | 0.00 | 103 | San Jose State | 0.00 | 103 | San Jose State | 0.00 | 103 | San Jose State | 0.00 | ||||
| 104 | SMU | 0.00 | 104 | SMU | 0.00 | 104 | SMU | 0.00 | 104 | SMU | 0.00 | 104 | SMU | 0.00 | ||||
| 105 | Southern Miss | 0.00 | 105 | Southern Miss | 0.00 | 105 | Southern Miss | 0.00 | 105 | Southern Miss | 0.00 | 105 | Southern Miss | 0.00 | ||||
| 106 | TCU | 0.00 | 106 | TCU | 0.00 | 106 | TCU | 0.00 | 106 | TCU | 0.00 | 106 | TCU | 0.00 | ||||
| 107 | Temple | 0.00 | 107 | Temple | 0.00 | 107 | Temple | 0.00 | 107 | Temple | 0.00 | 107 | Temple | 0.00 | ||||
| 108 | Toledo | 0.00 | 108 | Toledo | 0.00 | 108 | Toledo | 0.00 | 108 | Toledo | 0.00 | 108 | Toledo | 0.00 | ||||
| 109 | Troy | 0.00 | 109 | Troy | 0.00 | 109 | Troy | 0.00 | 109 | Troy | 0.00 | 109 | Troy | 0.00 | ||||
| 110 | Tulane | 0.00 | 110 | Tulane | 0.00 | 110 | Tulane | 0.00 | 110 | Tulane | 0.00 | 110 | Tulane | 0.00 | ||||
| 111 | Tulsa | 0.00 | 111 | Tulsa | 0.00 | 111 | Tulsa | 0.00 | 111 | Tulsa | 0.00 | 111 | Tulsa | 0.00 | ||||
| 112 | UAB | 0.00 | 112 | UAB | 0.00 | 112 | UAB | 0.00 | 112 | UAB | 0.00 | 112 | UAB | 0.00 | ||||
| 113 | UCF | 0.00 | 113 | UCF | 0.00 | 113 | UCF | 0.00 | 113 | UCF | 0.00 | 113 | UCF | 0.00 | ||||
| 114 | UNLV | 0.00 | 114 | UNLV | 0.00 | 114 | UNLV | 0.00 | 114 | UNLV | 0.00 | 114 | UNLV | 0.00 | ||||
| 115 | Utah | 0.00 | 115 | Utah | 0.00 | 115 | Utah | 0.00 | 115 | Utah | 0.00 | 115 | Utah | 0.00 | ||||
| 116 | Utah State | 0.00 | 116 | Utah State | 0.00 | 116 | Utah State | 0.00 | 116 | Utah State | 0.00 | 116 | Utah State | 0.00 | ||||
| 117 | UTEP | 0.00 | 117 | UTEP | 0.00 | 117 | UTEP | 0.00 | 117 | UTEP | 0.00 | 117 | UTEP | 0.00 | ||||
| 118 | Western Kentucky | 0.00 | 118 | Western Kentucky | 0.00 | 118 | Western Kentucky | 0.00 | 118 | Western Kentucky | 0.00 | 118 | Western Kentucky | 0.00 | ||||
| 119 | Western Michigan | 0.00 | 119 | Western Michigan | 0.00 | 119 | Western Michigan | 0.00 | 119 | Western Michigan | 0.00 | 119 | Western Michigan | 0.00 | ||||
| 120 | Wyoming | 0.00 | 120 | Wyoming | 0.00 | 120 | Wyoming | 0.00 | 120 | Wyoming | 0.00 | 120 | Wyoming | 0.00 |

Added 12/21/2009