Normalized Probabilities Case 3, Sub-analysis 4: 2006 - 2009 Rivals 250 Lists as Population Source, Scaling Competition by Winning Percentage (Past 10 and Past 3 Years) & Conference Scale Factor = 0
As seen in Case 3.3.2, scaling by winning percentage more closely matches real-life recruiting results, and the effect is closer to reality when the winning percentage is scaled by raising it to the fourth power. One would also imagine that the ten year time period is somewhat arbitrary and that the effect would be different depending how far back in time you go--a recruit might remember a team's performance more generally over a decade-long period but would probably be paying more attention to recent history, e.g. since the recruit has been in high school/the past few years.
With this is mind, I've added a separate variable for winning percentage over the past three years. As a starting point I kept the 10-year exponent to 4 which yielded better results than when I reset this to 1 and hence am only presenting these results below. Incidentally, you will notice that this step in fact does not reduce the error--it increases a very small amount from 505 to 508 (note: if I add up the sum of squared errors as opposed to the absolute value of the errors the spread is not much larger).
The lowest error is obtained when the 3-year winning percentage is kept to the power of one (with the 10-year winning percentage kept to the fourth power). As a result, the tables do not look much different than in Case 3.3.2. Notre Dame and Alabama again are in the "overperformer"' category. Seeing some of the teams on this overperformer list requires me to again warn that this is merely recruiting overperforming which is also often indicative (see Notre Dame, Illinois) that somehow manage to recruit well despite consistent mediocrity on the field.
In Table II it is interesting to compare Auburn and Alabama as the 3-year exponent is increased. Essentially what Alabama would get under such a model goes to almost zero while Auburn's skyrockets to well over 40. This shows the volatility of three year spans--over ten seasons most teams will end up towards their historic baseline winning percentage, but three year stretches can be particularly outstanding (Auburn) or poor (Alabama, pre-Saban).
Table II also makes clear that I have no cap on how many recruits a team can end up: Ohio State, Texas, and USC end up in the triple figures (exceeding NCAA scholarship limits). It is only these absurb numbers which make USC's actual recruiting hauls look normal.
What to do about teams like Notre Dame and Alabama? Stay tuned for the next case which accounts for these schools tradional powerhouse status--and in turn brings teams like Virginia Tech and Louisville back to earth. Finally, why include this variable if it does not appear to reduce the error? I have a hunch it'll come in handy as a couple more variables are added. Furthermore, it makes intuitive sense as a recruiting consideration without over-specifying the system.
A note about the tables. I only included teams in the Big 6 conferences (plus Notre Dame) as all the other teams have expected recruit values of zero for any winning percentage scaling due to the AQ scaling being set to zero.
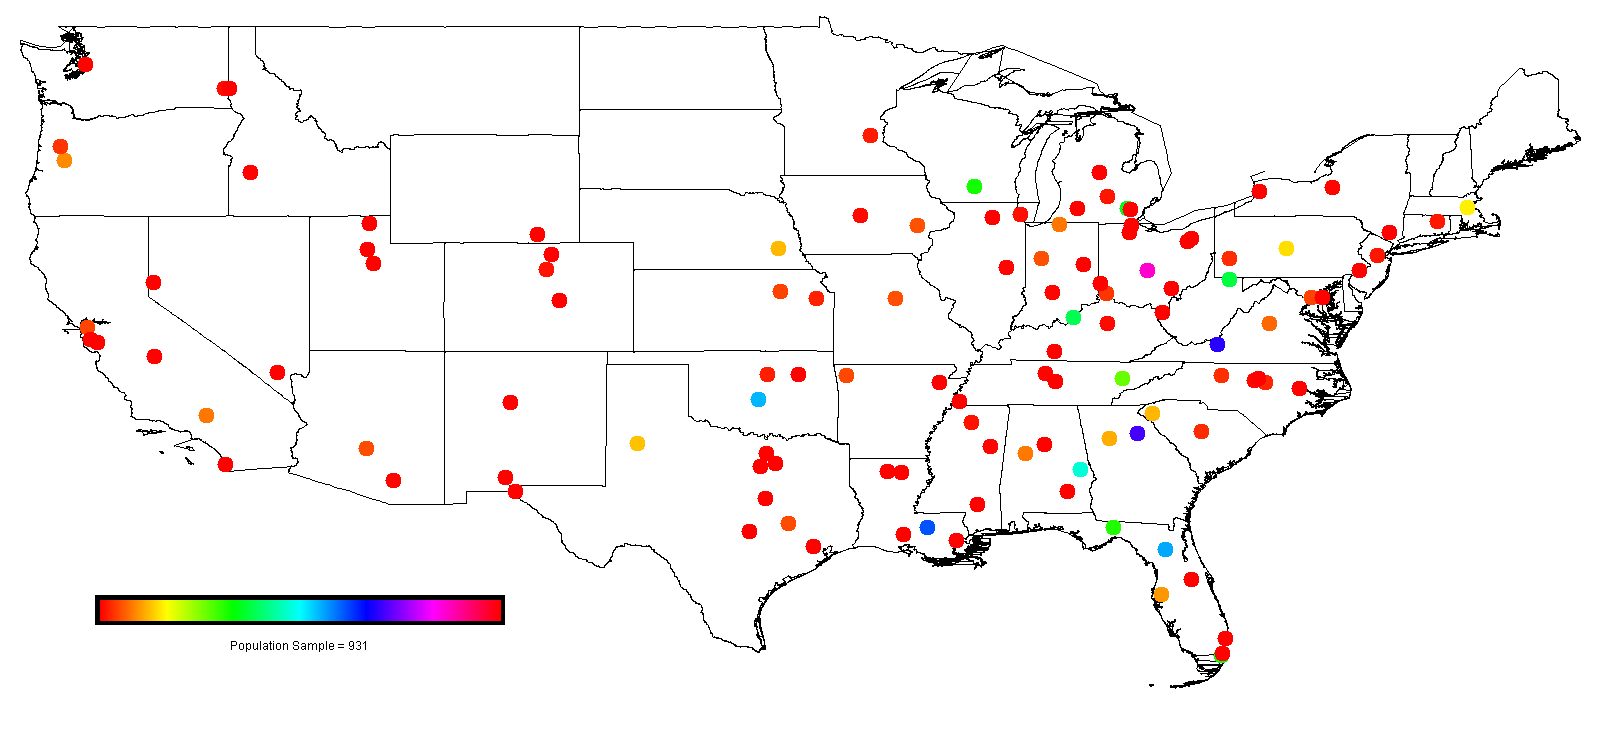
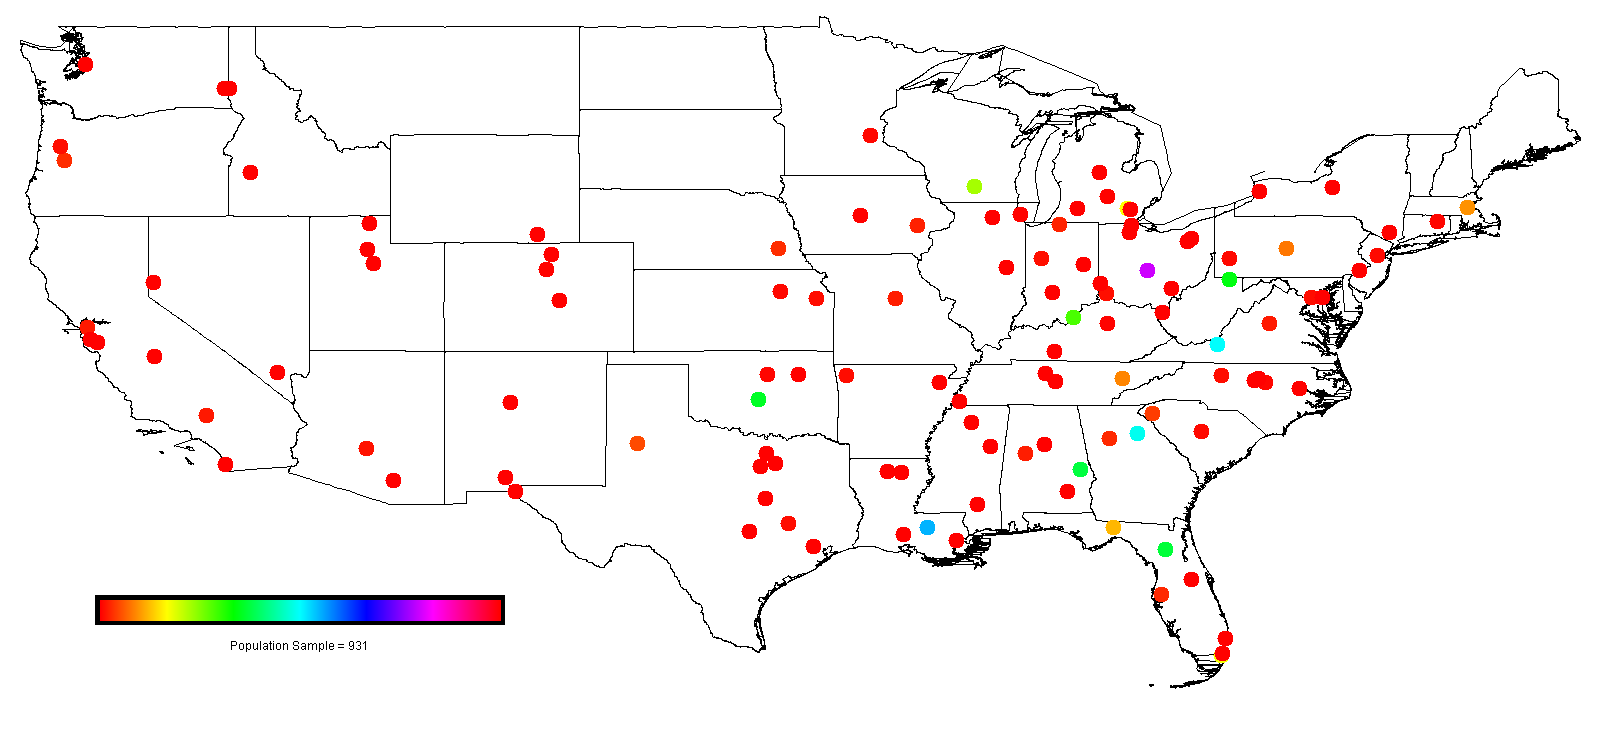
A note about the images. The circles indicate the number of recruits and location of the 120 schools. They're pretty straightforward except for when non-AQ schools are scaled to zero, then the images don't distinguish "good red" from "bad red". Keeping in mind that the top schools are all in the southeast should help you make sense of it, however.
Table I - Under and Overperformers (Exponent = 1)
| Overperformers | Underperformers | About As Expected | |||||||||||||
| Rank | College | Expected | Actual | Difference | Rank | College | Expected | Actual | Difference | College | Expected | Actual | Difference | ||
| 1 | Notre Dame | 11.39 | 39.99 | 28.60 | 1 | Virginia Tech | 47.26 | 11.16 | -36.10 | Michigan | 33.55 | 38.13 | 4.58 | ||
| 2 | Alabama | 11.69 | 39.06 | 27.37 | 2 | Louisville | 28.03 | 2.79 | -25.24 | Ole Miss | 5.19 | 9.30 | 4.11 | ||
| 3 | North Carolina | 2.62 | 16.74 | 14.12 | 3 | Wisconsin | 23.51 | 6.51 | -17.00 | Duke | 0.01 | 2.79 | 2.78 | ||
| 4 | UCLA | 13.96 | 27.90 | 13.94 | 4 | West Virginia | 21.61 | 4.65 | -16.96 | Arizona State | 7.87 | 10.23 | 2.36 | ||
| 5 | South Carolina | 4.55 | 17.67 | 13.12 | 5 | Tennessee | 35.08 | 20.46 | -14.62 | Michigan State | 4.46 | 6.51 | 2.05 | ||
| 6 | Illinois | 0.95 | 13.02 | 12.07 | 6 | South Florida | 15.76 | 2.79 | -12.97 | Baylor | 0.24 | 1.86 | 1.62 | ||
| 7 | Clemson | 14.09 | 26.04 | 11.95 | 7 | Nebraska | 18.59 | 7.44 | -11.15 | Maryland | 7.94 | 9.30 | 1.36 | ||
| 8 | LSU | 34.00 | 45.57 | 11.57 | 8 | Kansas State | 12.98 | 1.86 | -11.12 | Oregon | 11.25 | 12.09 | 0.84 | ||
| 9 | Penn State | 13.80 | 25.11 | 11.31 | 9 | Georgia Tech | 18.40 | 7.44 | -10.96 | Minnesota | 3.44 | 3.72 | 0.28 | ||
| 10 | Florida | 41.03 | 52.08 | 11.05 | 10 | Purdue | 10.40 | 0.00 | -10.40 | Kentucky | 1.76 | 1.86 | 0.10 | ||
| 11 | California | 4.78 | 14.88 | 10.10 | 11 | Ohio State | 49.94 | 39.99 | -9.95 | Iowa | 6.48 | 6.51 | 0.03 | ||
| 12 | Pittsburgh | 6.03 | 14.88 | 8.85 | 12 | Georgia | 49.76 | 39.99 | -9.77 | Vanderbilt | 0.37 | 0.00 | -0.37 | ||
| 13 | Mississippi State | 2.00 | 10.23 | 8.23 | 13 | Texas Tech | 13.11 | 3.72 | -9.39 | Arkansas | 9.97 | 9.30 | -0.67 | ||
| 14 | Arizona | 1.57 | 9.30 | 7.73 | 14 | Auburn | 30.15 | 23.25 | -6.90 | Indiana | 0.74 | 0.00 | -0.74 | ||
| 15 | USC | 46.03 | 53.01 | 6.98 | 15 | Oklahoma | 38.10 | 32.55 | -5.55 | Iowa State | 1.80 | 0.93 | -0.87 | ||
| 16 | Oklahoma State | 4.65 | 11.16 | 6.51 | 16 | Boston College | 11.74 | 6.51 | -5.23 | Northwestern | 2.36 | 0.93 | -1.43 | ||
| 17 | Colorado | 3.95 | 10.23 | 6.28 | Texas A&M | 10.77 | 9.30 | -1.47 | |||||||
| 18 | Washington | 1.28 | 6.51 | 5.23 | Kansas | 2.67 | 0.93 | -1.74 | |||||||
| 19 | Stanford | 1.31 | 6.51 | 5.20 | Syracuse | 1.96 | 0.00 | -1.96 | |||||||
| 20 | Rutgers | 1.45 | 6.51 | 5.06 | Miami | 35.58 | 33.48 | -2.10 | |||||||
| Oregon State | 5.23 | 2.79 | -2.44 | ||||||||||||
| Washington State | 2.51 | 0.00 | -2.51 | ||||||||||||
| Connecticut | 2.79 | 0.00 | -2.79 | ||||||||||||
| Florida State | 38.42 | 35.34 | -3.08 | ||||||||||||
| NC State | 7.10 | 3.72 | -3.38 | ||||||||||||
| Missouri | 6.18 | 2.79 | -3.39 | ||||||||||||
| Texas | 51.82 | 48.36 | -3.46 | ||||||||||||
| Virginia | 11.50 | 7.44 | -4.06 | ||||||||||||
| Cincinnati | 5.21 | 0.93 | -4.28 | ||||||||||||
| Wake Forest | 4.28 | 0.00 | -4.28 | ||||||||||||
Table II - Actual vs. Modeled Number of Recruits, Teams Sorted Alphabetically
| College | 1 | 2 | 4 | 8 | Actual | College | 1 | 2 | 4 | 8 | Actual | |
| Alabama | 12.35 | 10.42 | 6.80 | 2.36 | 39.14 | NC State | 6.96 | 4.62 | 1.98 | 0.38 | 3.73 | |
| Arizona | 1.46 | 0.73 | 0.18 | 0.01 | 9.32 | Nebraska | 18.78 | 15.93 | 10.46 | 3.65 | 7.46 | |
| Arizona State | 7.77 | 6.60 | 4.28 | 1.43 | 10.25 | North Carolina | 2.63 | 1.41 | 0.38 | 0.02 | 16.78 | |
| Arkansas | 9.53 | 7.29 | 3.92 | 0.93 | 9.32 | Northwestern | 2.57 | 1.79 | 0.80 | 0.13 | 0.93 | |
| Auburn | 30.97 | 34.96 | 41.20 | 47.69 | 23.30 | Notre Dame | 11.11 | 9.60 | 6.64 | 2.71 | 40.08 | |
| Baylor | 0.25 | 0.12 | 0.03 | 0.00 | 1.86 | Ohio State | 49.08 | 58.25 | 75.25 | 102.09 | 40.08 | |
| Boston College | 12.07 | 12.95 | 13.61 | 12.10 | 6.52 | Oklahoma | 40.12 | 43.77 | 47.59 | 45.57 | 32.62 | |
| California | 4.88 | 4.65 | 3.80 | 2.00 | 14.91 | Oklahoma State | 4.85 | 3.49 | 1.66 | 0.32 | 11.18 | |
| Cincinnati | 5.92 | 4.75 | 2.93 | 1.11 | 0.93 | Ole Miss | 5.30 | 2.82 | 0.85 | 0.09 | 9.32 | |
| Clemson | 14.76 | 13.47 | 10.31 | 4.90 | 26.10 | Oregon | 10.90 | 10.08 | 7.75 | 3.65 | 12.12 | |
| Colorado | 3.84 | 2.49 | 0.99 | 0.14 | 10.25 | Oregon State | 5.12 | 4.36 | 2.87 | 1.02 | 2.80 | |
| Connecticut | 2.84 | 2.17 | 1.21 | 0.37 | 0.00 | Penn State | 13.94 | 13.63 | 12.57 | 9.81 | 25.16 | |
| Duke | 0.01 | 0.00 | 0.00 | 0.00 | 2.80 | Pittsburgh | 6.50 | 4.76 | 2.43 | 0.58 | 14.91 | |
| Florida | 41.88 | 44.97 | 48.31 | 47.18 | 52.19 | Purdue | 9.95 | 7.80 | 4.39 | 1.13 | 0.00 | |
| Florida State | 38.16 | 34.69 | 27.16 | 15.13 | 35.42 | Rutgers | 1.52 | 1.42 | 1.16 | 0.65 | 6.52 | |
| Georgia | 50.04 | 55.24 | 61.75 | 62.43 | 40.08 | South Carolina | 5.03 | 4.01 | 2.34 | 0.65 | 17.71 | |
| Georgia Tech | 18.14 | 15.22 | 9.82 | 3.29 | 7.46 | South Florida | 15.84 | 13.15 | 8.57 | 3.24 | 2.80 | |
| Illinois | 1.00 | 0.46 | 0.10 | 0.01 | 13.05 | Stanford | 1.32 | 0.63 | 0.14 | 0.01 | 6.52 | |
| Indiana | 0.72 | 0.41 | 0.13 | 0.01 | 0.00 | Syracuse | 1.89 | 0.86 | 0.18 | 0.01 | 0.00 | |
| Iowa | 6.92 | 6.05 | 4.52 | 2.55 | 6.52 | Tennessee | 33.16 | 30.23 | 23.08 | 11.00 | 20.50 | |
| Iowa State | 1.78 | 1.10 | 0.39 | 0.05 | 0.93 | Texas | 52.84 | 64.34 | 86.95 | 127.51 | 48.46 | |
| Kansas | 2.87 | 2.49 | 1.80 | 0.87 | 0.93 | Texas A&M | 10.15 | 7.73 | 4.15 | 1.01 | 9.32 | |
| Kansas State | 12.56 | 8.58 | 3.68 | 0.56 | 1.86 | Texas Tech | 13.62 | 13.07 | 10.94 | 6.11 | 3.73 | |
| Kentucky | 1.74 | 1.11 | 0.47 | 0.09 | 1.86 | UCLA | 13.10 | 10.84 | 6.64 | 1.94 | 27.96 | |
| Louisville | 27.51 | 30.10 | 33.61 | 36.32 | 2.80 | USC | 47.15 | 57.69 | 77.66 | 110.19 | 53.12 | |
| LSU | 35.23 | 41.66 | 53.23 | 70.05 | 45.67 | Vanderbilt | 0.43 | 0.23 | 0.06 | 0.00 | 0.93 | |
| Maryland | 8.41 | 6.54 | 3.63 | 0.92 | 9.32 | Virginia | 10.96 | 9.07 | 5.77 | 1.98 | 7.46 | |
| Miami | 35.10 | 33.17 | 28.90 | 21.95 | 33.55 | Virginia Tech | 46.95 | 52.52 | 60.16 | 63.53 | 11.18 | |
| Michigan | 31.79 | 32.10 | 29.94 | 21.02 | 38.21 | Wake Forest | 4.67 | 3.84 | 2.50 | 0.98 | 0.00 | |
| Michigan State | 4.57 | 2.97 | 1.17 | 0.16 | 6.52 | Washington | 1.18 | 0.45 | 0.06 | 0.00 | 6.52 | |
| Minnesota | 3.53 | 2.58 | 1.45 | 0.52 | 3.73 | Washington State | 2.43 | 1.63 | 0.68 | 0.10 | 0.00 | |
| Mississippi State | 1.90 | 0.86 | 0.18 | 0.01 | 10.25 | West Virginia | 21.60 | 25.44 | 32.51 | 43.80 | 4.66 | |
| Missouri | 6.28 | 5.68 | 4.37 | 2.31 | 2.80 | Wisconsin | 22.56 | 24.94 | 27.95 | 28.67 | 6.52 | |
| Total Deviation from Actual | 508.31 | 542.91 | 661.94 | 877.41 | ||||||||
Table III - Recruiting Ranking, Actual vs. Modeled, Teams Sorted Alphabetically
| College | 1 | 2 | 4 | 8 | Actual | College | 1 | 2 | 4 | 8 | Actual | |
| Alabama | 25 | 25 | 25 | 27 | 8 | NC State | 35 | 40 | 43 | 46 | 46 | |
| Arizona | 59 | 59 | 59 | 57 | 29 | Nebraska | 17 | 17 | 20 | 21 | 35 | |
| Arizona State | 34 | 33 | 32 | 32 | 26 | North Carolina | 51 | 54 | 56 | 56 | 19 | |
| Arkansas | 32 | 32 | 34 | 38 | 30 | Northwestern | 52 | 51 | 52 | 51 | 62 | |
| Auburn | 13 | 9 | 9 | 7 | 16 | Notre Dame | 27 | 27 | 26 | 25 | 6 | |
| Baylor | 65 | 65 | 65 | 65 | 53 | Ohio State | 3 | 2 | 3 | 3 | 6 | |
| Boston College | 26 | 23 | 17 | 16 | 37 | Oklahoma | 7 | 7 | 8 | 9 | 12 | |
| California | 43 | 39 | 35 | 29 | 20 | Oklahoma State | 44 | 44 | 45 | 48 | 24 | |
| Cincinnati | 39 | 38 | 38 | 34 | 58 | Ole Miss | 40 | 46 | 51 | 53 | 32 | |
| Clemson | 20 | 20 | 21 | 20 | 14 | Oregon | 29 | 26 | 24 | 22 | 23 | |
| Colorado | 47 | 48 | 50 | 50 | 27 | Oregon State | 41 | 41 | 39 | 35 | 51 | |
| Connecticut | 50 | 50 | 47 | 47 | 68 | Penn State | 21 | 19 | 18 | 18 | 15 | |
| Duke | 66 | 66 | 66 | 66 | 48 | Pittsburgh | 37 | 37 | 41 | 43 | 21 | |
| Florida | 6 | 6 | 7 | 8 | 2 | Purdue | 31 | 30 | 30 | 33 | 68 | |
| Florida State | 8 | 10 | 15 | 15 | 10 | Rutgers | 58 | 53 | 49 | 41 | 40 | |
| Georgia | 2 | 4 | 4 | 6 | 5 | South Carolina | 42 | 42 | 42 | 42 | 18 | |
| Georgia Tech | 18 | 18 | 22 | 23 | 34 | South Florida | 19 | 21 | 23 | 24 | 52 | |
| Illinois | 62 | 61 | 62 | 62 | 22 | Stanford | 60 | 60 | 60 | 61 | 41 | |
| Indiana | 63 | 63 | 61 | 58 | 68 | Syracuse | 55 | 58 | 58 | 60 | 68 | |
| Iowa | 36 | 35 | 29 | 26 | 38 | Tennessee | 11 | 13 | 16 | 17 | 17 | |
| Iowa State | 56 | 56 | 55 | 55 | 60 | Texas | 1 | 1 | 1 | 1 | 3 | |
| Kansas | 49 | 49 | 44 | 40 | 61 | Texas A&M | 30 | 31 | 33 | 36 | 33 | |
| Kansas State | 24 | 29 | 36 | 44 | 54 | Texas Tech | 22 | 22 | 19 | 19 | 47 | |
| Kentucky | 57 | 55 | 54 | 54 | 55 | UCLA | 23 | 24 | 27 | 31 | 13 | |
| Louisville | 14 | 14 | 10 | 11 | 49 | USC | 4 | 3 | 2 | 2 | 1 | |
| LSU | 9 | 8 | 6 | 4 | 4 | Vanderbilt | 64 | 64 | 63 | 63 | 68 | |
| Maryland | 33 | 34 | 37 | 39 | 31 | Virginia | 28 | 28 | 28 | 30 | 36 | |
| Miami | 10 | 11 | 13 | 13 | 11 | Virginia Tech | 5 | 5 | 5 | 5 | 25 | |
| Michigan | 12 | 12 | 12 | 14 | 9 | Wake Forest | 45 | 43 | 40 | 37 | 68 | |
| Michigan State | 46 | 45 | 48 | 49 | 39 | Washington | 61 | 62 | 64 | 64 | 42 | |
| Minnesota | 48 | 47 | 46 | 45 | 45 | Washington State | 53 | 52 | 53 | 52 | 68 | |
| Mississippi State | 54 | 57 | 57 | 59 | 28 | West Virginia | 16 | 15 | 11 | 10 | 44 | |
| Missouri | 38 | 36 | 31 | 28 | 50 | Wisconsin | 15 | 16 | 14 | 12 | 43 |
Table IV - Rankings for Each Scale Factor
| Exponent = 1.0 | Exponent = 2.0 | Exponent = 4.0 | Exponent = 8.0 | ||||||||||||
| Rank | College | Recruits | Rank | College | Recruits | Rank | College | Recruits | Rank | College | Recruits | ||||
| 1 | Texas | 52.84 | 1 | Texas | 64.34 | 1 | Texas | 86.95 | 1 | Texas | 127.51 | ||||
| 2 | Georgia | 50.04 | 2 | Ohio State | 58.25 | 2 | USC | 77.66 | 2 | USC | 110.19 | ||||
| 3 | Ohio State | 49.08 | 3 | USC | 57.69 | 3 | Ohio State | 75.25 | 3 | Ohio State | 102.09 | ||||
| 4 | USC | 47.15 | 4 | Georgia | 55.24 | 4 | Georgia | 61.75 | 4 | LSU | 70.05 | ||||
| 5 | Virginia Tech | 46.95 | 5 | Virginia Tech | 52.52 | 5 | Virginia Tech | 60.16 | 5 | Virginia Tech | 63.53 | ||||
| 6 | Florida | 41.88 | 6 | Florida | 44.97 | 6 | LSU | 53.23 | 6 | Georgia | 62.43 | ||||
| 7 | Oklahoma | 40.12 | 7 | Oklahoma | 43.77 | 7 | Florida | 48.31 | 7 | Auburn | 47.69 | ||||
| 8 | Florida State | 38.16 | 8 | LSU | 41.66 | 8 | Oklahoma | 47.59 | 8 | Florida | 47.18 | ||||
| 9 | LSU | 35.23 | 9 | Auburn | 34.96 | 9 | Auburn | 41.20 | 9 | Oklahoma | 45.57 | ||||
| 10 | Miami | 35.10 | 10 | Florida State | 34.69 | 10 | Louisville | 33.61 | 10 | West Virginia | 43.80 | ||||
| 11 | Tennessee | 33.16 | 11 | Miami | 33.17 | 11 | West Virginia | 32.51 | 11 | Louisville | 36.32 | ||||
| 12 | Michigan | 31.79 | 12 | Michigan | 32.10 | 12 | Michigan | 29.94 | 12 | Wisconsin | 28.67 | ||||
| 13 | Auburn | 30.97 | 13 | Tennessee | 30.23 | 13 | Miami | 28.90 | 13 | Miami | 21.95 | ||||
| 14 | Louisville | 27.51 | 14 | Louisville | 30.10 | 14 | Wisconsin | 27.95 | 14 | Michigan | 21.02 | ||||
| 15 | Wisconsin | 22.56 | 15 | West Virginia | 25.44 | 15 | Florida State | 27.16 | 15 | Florida State | 15.13 | ||||
| 16 | West Virginia | 21.60 | 16 | Wisconsin | 24.94 | 16 | Tennessee | 23.08 | 16 | Boston College | 12.10 | ||||
| 17 | Nebraska | 18.78 | 17 | Nebraska | 15.93 | 17 | Boston College | 13.61 | 17 | Tennessee | 11.00 | ||||
| 18 | Georgia Tech | 18.14 | 18 | Georgia Tech | 15.22 | 18 | Penn State | 12.57 | 18 | Penn State | 9.81 | ||||
| 19 | South Florida | 15.84 | 19 | Penn State | 13.63 | 19 | Texas Tech | 10.94 | 19 | Texas Tech | 6.11 | ||||
| 20 | Clemson | 14.76 | 20 | Clemson | 13.47 | 20 | Nebraska | 10.46 | 20 | Clemson | 4.90 | ||||
| 21 | Penn State | 13.94 | 21 | South Florida | 13.15 | 21 | Clemson | 10.31 | 21 | Nebraska | 3.65 | ||||
| 22 | Texas Tech | 13.62 | 22 | Texas Tech | 13.07 | 22 | Georgia Tech | 9.82 | 22 | Oregon | 3.65 | ||||
| 23 | UCLA | 13.10 | 23 | Boston College | 12.95 | 23 | South Florida | 8.57 | 23 | Georgia Tech | 3.29 | ||||
| 24 | Kansas State | 12.56 | 24 | UCLA | 10.84 | 24 | Oregon | 7.75 | 24 | South Florida | 3.24 | ||||
| 25 | Alabama | 12.35 | 25 | Alabama | 10.42 | 25 | Alabama | 6.80 | 25 | Notre Dame | 2.71 | ||||
| 26 | Boston College | 12.07 | 26 | Oregon | 10.08 | 26 | Notre Dame | 6.64 | 26 | Iowa | 2.55 | ||||
| 27 | Notre Dame | 11.11 | 27 | Notre Dame | 9.60 | 27 | UCLA | 6.64 | 27 | Alabama | 2.36 | ||||
| 28 | Virginia | 10.96 | 28 | Virginia | 9.07 | 28 | Virginia | 5.77 | 28 | Missouri | 2.31 | ||||
| 29 | Oregon | 10.90 | 29 | Kansas State | 8.58 | 29 | Iowa | 4.52 | 29 | California | 2.00 | ||||
| 30 | Texas A&M | 10.15 | 30 | Purdue | 7.80 | 30 | Purdue | 4.39 | 30 | Virginia | 1.98 | ||||
| 31 | Purdue | 9.95 | 31 | Texas A&M | 7.73 | 31 | Missouri | 4.37 | 31 | UCLA | 1.94 | ||||
| 32 | Arkansas | 9.53 | 32 | Arkansas | 7.29 | 32 | Arizona State | 4.28 | 32 | Arizona State | 1.43 | ||||
| 33 | Maryland | 8.41 | 33 | Arizona State | 6.60 | 33 | Texas A&M | 4.15 | 33 | Purdue | 1.13 | ||||
| 34 | Arizona State | 7.77 | 34 | Maryland | 6.54 | 34 | Arkansas | 3.92 | 34 | Cincinnati | 1.11 | ||||
| 35 | NC State | 6.96 | 35 | Iowa | 6.05 | 35 | California | 3.80 | 35 | Oregon State | 1.02 | ||||
| 36 | Iowa | 6.92 | 36 | Missouri | 5.68 | 36 | Kansas State | 3.68 | 36 | Texas A&M | 1.01 | ||||
| 37 | Pittsburgh | 6.50 | 37 | Pittsburgh | 4.76 | 37 | Maryland | 3.63 | 37 | Wake Forest | 0.98 | ||||
| 38 | Missouri | 6.28 | 38 | Cincinnati | 4.75 | 38 | Cincinnati | 2.93 | 38 | Arkansas | 0.93 | ||||
| 39 | Cincinnati | 5.92 | 39 | California | 4.65 | 39 | Oregon State | 2.87 | 39 | Maryland | 0.92 | ||||
| 40 | Ole Miss | 5.30 | 40 | NC State | 4.62 | 40 | Wake Forest | 2.50 | 40 | Kansas | 0.87 | ||||
| 41 | Oregon State | 5.12 | 41 | Oregon State | 4.36 | 41 | Pittsburgh | 2.43 | 41 | Rutgers | 0.65 | ||||
| 42 | South Carolina | 5.03 | 42 | South Carolina | 4.01 | 42 | South Carolina | 2.34 | 42 | South Carolina | 0.65 | ||||
| 43 | California | 4.88 | 43 | Wake Forest | 3.84 | 43 | NC State | 1.98 | 43 | Pittsburgh | 0.58 | ||||
| 44 | Oklahoma State | 4.85 | 44 | Oklahoma State | 3.49 | 44 | Kansas | 1.80 | 44 | Kansas State | 0.56 | ||||
| 45 | Wake Forest | 4.67 | 45 | Michigan State | 2.97 | 45 | Oklahoma State | 1.66 | 45 | Minnesota | 0.52 | ||||
| 46 | Michigan State | 4.57 | 46 | Ole Miss | 2.82 | 46 | Minnesota | 1.45 | 46 | NC State | 0.38 | ||||
| 47 | Colorado | 3.84 | 47 | Minnesota | 2.58 | 47 | Connecticut | 1.21 | 47 | Connecticut | 0.37 | ||||
| 48 | Minnesota | 3.53 | 48 | Colorado | 2.49 | 48 | Michigan State | 1.17 | 48 | Oklahoma State | 0.32 | ||||
| 49 | Kansas | 2.87 | 49 | Kansas | 2.49 | 49 | Rutgers | 1.16 | 49 | Michigan State | 0.16 | ||||
| 50 | Connecticut | 2.84 | 50 | Connecticut | 2.17 | 50 | Colorado | 0.99 | 50 | Colorado | 0.14 | ||||
| 51 | North Carolina | 2.63 | 51 | Northwestern | 1.79 | 51 | Ole Miss | 0.85 | 51 | Northwestern | 0.13 | ||||
| 52 | Northwestern | 2.57 | 52 | Washington State | 1.63 | 52 | Northwestern | 0.80 | 52 | Washington State | 0.10 | ||||
| 53 | Washington State | 2.43 | 53 | Rutgers | 1.42 | 53 | Washington State | 0.68 | 53 | Ole Miss | 0.09 | ||||
| 54 | Mississippi State | 1.90 | 54 | North Carolina | 1.41 | 54 | Kentucky | 0.47 | 54 | Kentucky | 0.09 | ||||
| 55 | Syracuse | 1.89 | 55 | Kentucky | 1.11 | 55 | Iowa State | 0.39 | 55 | Iowa State | 0.05 | ||||
| 56 | Iowa State | 1.78 | 56 | Iowa State | 1.10 | 56 | North Carolina | 0.38 | 56 | North Carolina | 0.02 | ||||
| 57 | Kentucky | 1.74 | 57 | Mississippi State | 0.86 | 57 | Mississippi State | 0.18 | 57 | Arizona | 0.01 | ||||
| 58 | Rutgers | 1.52 | 58 | Syracuse | 0.86 | 58 | Syracuse | 0.18 | 58 | Indiana | 0.01 | ||||
| 59 | Arizona | 1.46 | 59 | Arizona | 0.73 | 59 | Arizona | 0.18 | 59 | Mississippi State | 0.01 | ||||
| 60 | Stanford | 1.32 | 60 | Stanford | 0.63 | 60 | Stanford | 0.14 | 60 | Syracuse | 0.01 | ||||
| 61 | Washington | 1.18 | 61 | Illinois | 0.46 | 61 | Indiana | 0.13 | 61 | Stanford | 0.01 | ||||
| 62 | Illinois | 1.00 | 62 | Washington | 0.45 | 62 | Illinois | 0.10 | 62 | Illinois | 0.01 | ||||
| 63 | Indiana | 0.72 | 63 | Indiana | 0.41 | 63 | Vanderbilt | 0.06 | 63 | Vanderbilt | 0.00 | ||||
| 64 | Vanderbilt | 0.43 | 64 | Vanderbilt | 0.23 | 64 | Washington | 0.06 | 64 | Washington | 0.00 | ||||
| 65 | Baylor | 0.25 | 65 | Baylor | 0.12 | 65 | Baylor | 0.03 | 65 | Baylor | 0.00 | ||||
| 66 | Duke | 0.01 | 66 | Duke | 0.00 | 66 | Duke | 0.00 | 66 | Duke | 0.00 | ||||
| 67 | Air Force | 0.00 | 67 | Air Force | 0.00 | 67 | Air Force | 0.00 | 67 | Air Force | 0.00 | ||||
| 68 | Akron | 0.00 | 68 | Akron | 0.00 | 68 | Akron | 0.00 | 68 | Akron | 0.00 | ||||
| 69 | Arkansas State | 0.00 | 69 | Arkansas State | 0.00 | 69 | Arkansas State | 0.00 | 69 | Arkansas State | 0.00 | ||||
| 70 | Army | 0.00 | 70 | Army | 0.00 | 70 | Army | 0.00 | 70 | Army | 0.00 | ||||
| 71 | Ball State | 0.00 | 71 | Ball State | 0.00 | 71 | Ball State | 0.00 | 71 | Ball State | 0.00 | ||||
| 72 | Boise State | 0.00 | 72 | Boise State | 0.00 | 72 | Boise State | 0.00 | 72 | Boise State | 0.00 | ||||
| 73 | Bowling Green | 0.00 | 73 | Bowling Green | 0.00 | 73 | Bowling Green | 0.00 | 73 | Bowling Green | 0.00 | ||||
| 74 | Buffalo | 0.00 | 74 | Buffalo | 0.00 | 74 | Buffalo | 0.00 | 74 | Buffalo | 0.00 | ||||
| 75 | BYU | 0.00 | 75 | BYU | 0.00 | 75 | BYU | 0.00 | 75 | BYU | 0.00 | ||||
| 76 | Central Michigan | 0.00 | 76 | Central Michigan | 0.00 | 76 | Central Michigan | 0.00 | 76 | Central Michigan | 0.00 | ||||
| 77 | Colorado State | 0.00 | 77 | Colorado State | 0.00 | 77 | Colorado State | 0.00 | 77 | Colorado State | 0.00 | ||||
| 78 | Eastern Michigan | 0.00 | 78 | Eastern Michigan | 0.00 | 78 | Eastern Michigan | 0.00 | 78 | Eastern Michigan | 0.00 | ||||
| 79 | ECU | 0.00 | 79 | ECU | 0.00 | 79 | ECU | 0.00 | 79 | ECU | 0.00 | ||||
| 80 | FIU | 0.00 | 80 | FIU | 0.00 | 80 | FIU | 0.00 | 80 | FIU | 0.00 | ||||
| 81 | Florida Atlantic | 0.00 | 81 | Florida Atlantic | 0.00 | 81 | Florida Atlantic | 0.00 | 81 | Florida Atlantic | 0.00 | ||||
| 82 | Fresno State | 0.00 | 82 | Fresno State | 0.00 | 82 | Fresno State | 0.00 | 82 | Fresno State | 0.00 | ||||
| 83 | Hawaii | 0.00 | 83 | Hawaii | 0.00 | 83 | Hawaii | 0.00 | 83 | Hawaii | 0.00 | ||||
| 84 | Houston | 0.00 | 84 | Houston | 0.00 | 84 | Houston | 0.00 | 84 | Houston | 0.00 | ||||
| 85 | Idaho | 0.00 | 85 | Idaho | 0.00 | 85 | Idaho | 0.00 | 85 | Idaho | 0.00 | ||||
| 86 | Kent State | 0.00 | 86 | Kent State | 0.00 | 86 | Kent State | 0.00 | 86 | Kent State | 0.00 | ||||
| 87 | Louisiana Tech | 0.00 | 87 | Louisiana Tech | 0.00 | 87 | Louisiana Tech | 0.00 | 87 | Louisiana Tech | 0.00 | ||||
| 88 | Louisiana-Lafayette | 0.00 | 88 | Louisiana-Lafayette | 0.00 | 88 | Louisiana-Lafayette | 0.00 | 88 | Louisiana-Lafayette | 0.00 | ||||
| 89 | Louisiana-Monroe | 0.00 | 89 | Louisiana-Monroe | 0.00 | 89 | Louisiana-Monroe | 0.00 | 89 | Louisiana-Monroe | 0.00 | ||||
| 90 | Marshall | 0.00 | 90 | Marshall | 0.00 | 90 | Marshall | 0.00 | 90 | Marshall | 0.00 | ||||
| 91 | Memphis | 0.00 | 91 | Memphis | 0.00 | 91 | Memphis | 0.00 | 91 | Memphis | 0.00 | ||||
| 92 | Miami (OH) | 0.00 | 92 | Miami (OH) | 0.00 | 92 | Miami (OH) | 0.00 | 92 | Miami (OH) | 0.00 | ||||
| 93 | Middle Tennessee | 0.00 | 93 | Middle Tennessee | 0.00 | 93 | Middle Tennessee | 0.00 | 93 | Middle Tennessee | 0.00 | ||||
| 94 | Navy | 0.00 | 94 | Navy | 0.00 | 94 | Navy | 0.00 | 94 | Navy | 0.00 | ||||
| 95 | Nevada | 0.00 | 95 | Nevada | 0.00 | 95 | Nevada | 0.00 | 95 | Nevada | 0.00 | ||||
| 96 | New Mexico | 0.00 | 96 | New Mexico | 0.00 | 96 | New Mexico | 0.00 | 96 | New Mexico | 0.00 | ||||
| 97 | New Mexico State | 0.00 | 97 | New Mexico State | 0.00 | 97 | New Mexico State | 0.00 | 97 | New Mexico State | 0.00 | ||||
| 98 | North Texas | 0.00 | 98 | North Texas | 0.00 | 98 | North Texas | 0.00 | 98 | North Texas | 0.00 | ||||
| 99 | Northern Illinois | 0.00 | 99 | Northern Illinois | 0.00 | 99 | Northern Illinois | 0.00 | 99 | Northern Illinois | 0.00 | ||||
| 100 | Ohio | 0.00 | 100 | Ohio | 0.00 | 100 | Ohio | 0.00 | 100 | Ohio | 0.00 | ||||
| 101 | Rice | 0.00 | 101 | Rice | 0.00 | 101 | Rice | 0.00 | 101 | Rice | 0.00 | ||||
| 102 | San Diego State | 0.00 | 102 | San Diego State | 0.00 | 102 | San Diego State | 0.00 | 102 | San Diego State | 0.00 | ||||
| 103 | San Jose State | 0.00 | 103 | San Jose State | 0.00 | 103 | San Jose State | 0.00 | 103 | San Jose State | 0.00 | ||||
| 104 | SMU | 0.00 | 104 | SMU | 0.00 | 104 | SMU | 0.00 | 104 | SMU | 0.00 | ||||
| 105 | Southern Miss | 0.00 | 105 | Southern Miss | 0.00 | 105 | Southern Miss | 0.00 | 105 | Southern Miss | 0.00 | ||||
| 106 | TCU | 0.00 | 106 | TCU | 0.00 | 106 | TCU | 0.00 | 106 | TCU | 0.00 | ||||
| 107 | Temple | 0.00 | 107 | Temple | 0.00 | 107 | Temple | 0.00 | 107 | Temple | 0.00 | ||||
| 108 | Toledo | 0.00 | 108 | Toledo | 0.00 | 108 | Toledo | 0.00 | 108 | Toledo | 0.00 | ||||
| 109 | Troy | 0.00 | 109 | Troy | 0.00 | 109 | Troy | 0.00 | 109 | Troy | 0.00 | ||||
| 110 | Tulane | 0.00 | 110 | Tulane | 0.00 | 110 | Tulane | 0.00 | 110 | Tulane | 0.00 | ||||
| 111 | Tulsa | 0.00 | 111 | Tulsa | 0.00 | 111 | Tulsa | 0.00 | 111 | Tulsa | 0.00 | ||||
| 112 | UAB | 0.00 | 112 | UAB | 0.00 | 112 | UAB | 0.00 | 112 | UAB | 0.00 | ||||
| 113 | UCF | 0.00 | 113 | UCF | 0.00 | 113 | UCF | 0.00 | 113 | UCF | 0.00 | ||||
| 114 | UNLV | 0.00 | 114 | UNLV | 0.00 | 114 | UNLV | 0.00 | 114 | UNLV | 0.00 | ||||
| 115 | Utah | 0.00 | 115 | Utah | 0.00 | 115 | Utah | 0.00 | 115 | Utah | 0.00 | ||||
| 116 | Utah State | 0.00 | 116 | Utah State | 0.00 | 116 | Utah State | 0.00 | 116 | Utah State | 0.00 | ||||
| 117 | UTEP | 0.00 | 117 | UTEP | 0.00 | 117 | UTEP | 0.00 | 117 | UTEP | 0.00 | ||||
| 118 | Western Kentucky | 0.00 | 118 | Western Kentucky | 0.00 | 118 | Western Kentucky | 0.00 | 118 | Western Kentucky | 0.00 | ||||
| 119 | Western Michigan | 0.00 | 119 | Western Michigan | 0.00 | 119 | Western Michigan | 0.00 | 119 | Western Michigan | 0.00 | ||||
| 120 | Wyoming | 0.00 | 120 | Wyoming | 0.00 | 120 | Wyoming | 0.00 | 120 | Wyoming | 0.00 |


Added 03/23/2010