Normalized Probabilities Case 3, Sub-analysis 6: 2006 - 2009 Rivals 250 Lists as Population Source, Scaling Competition by Prestige, Winning Percentage (Past 10 and Past 3 Years) & Conference Scale Factor = 0, and Considering In-State and Private vs. Public
The last variable to add! Well, to be honest its actually two, but they are closely related. A look at college rosters indicates that teams tend to have a bit more luck recruiting within their own state for reasons explainable from both the team's position (closer ties with local high school coaches that play in the same leagues) and from the recruit's position (growing up in the shadow of the college program and often dreaming of getting a scholarship there). This case, therefore, tries to capture this phenomenon by multiplying the player's probability of going to schools in-state. I used 4 different scaling factors (multipliers, not exponents as with winning percentage) of 1.25, 1.50, 1.75, and 2.00.
Similarly, private schools tend to have a bit larger national reputation and are often immune from inter-state rivalries that may dissuade some recruits from going to nearby colleges in neighboring states. Notre Dame and USC are perhaps the most obvious examples of this (not that USC needs any more advantages being located in SoCal) but other schools such as Duke, Stanford, BC, Northwestern, et cetera have a widely distributed alumni population and typically are also known for their academics lending them further prestige. In order to account for this I gave private schools a 1.05 times multiplier for all out-of-state recruits while maintaining the higher larger multiplier for in-state recruits.
In the end this private school multiplier didn't affect much but I think it's a good complement to the in-state scaling. The in-state scaling had a smaller impact than I expected, lowering the total error from 379.52 to 370.07 for a 1.50 in-state multiplier (actually a pretty significant multiplier when one thinks about it--50% more likely to go to a school if it is in-state). I'll highlight that 370.07 one more time because this will be my starting point for the subsequent optimization. Also note that I used the exponents of 1, 1, and 2 for the 10-year winning percentage, 3-year winning percentage, and the prestige factors.
Given the small drop in errors, theres really not much to say relative to the results in Case 3.5 except that you can see, for example how the Florida schools definitely benefit when the in-state factor is increased (while Georgia and the other SEC-territory states all lose out a bit). All in all, the results are pretty similar to before.
This Prestige variable is the final variable I plan to add associated with a winning tradition. I plan of course to optimize these exponents more rigorously (and automatically) in order to minimize the error in predicted versus actual outcomes. Stay tuned for the next case, however, as I have one extra variable (this one geographic) to add into the mix before I jump to that.
Table I, in comparison to the previous cases, offers a few items of interest. Alabama and Notre Dame, while still present are not far ahead of others in the recruiting overperformers lists. The two big Carolina schools show up near the top; both schools recruit well but neither can match the tradition or performance of their souther rivals. The Florida/Illinois couple makes me think I should perhaps add a "Ron Zook" variable. I'm sure those two fanbases could discuss at much length what it means to overrecruit and underperform.
The Underperformer list is an interesting mix. On the one hand there are teams like Nebraska (plenty of tradition, not enough local recruits) and Ohio State (lots of other state schools vying for their recruits) which have plenty of tradition and schools like West Virginia and Georgia Tech which have a strong history but not quite the "it-factor" of the more storied programs. I'm a bit surprised by Tennessee's spot on this list. Perhaps this underrecruiting led to the disocntent with Phil Fulmer among Vols fans (5 top 250 recruits a year just doesn't cut it some places).
Finally, I'm impressed I got both Texas and USC to within +/- 5 recruits.
A note about the tables. I only included teams in the Big 6 conferences (plus Notre Dame) as all the other teams have expected recruit values of zero for any winning percentage scaling due to the AQ scaling being set to zero.
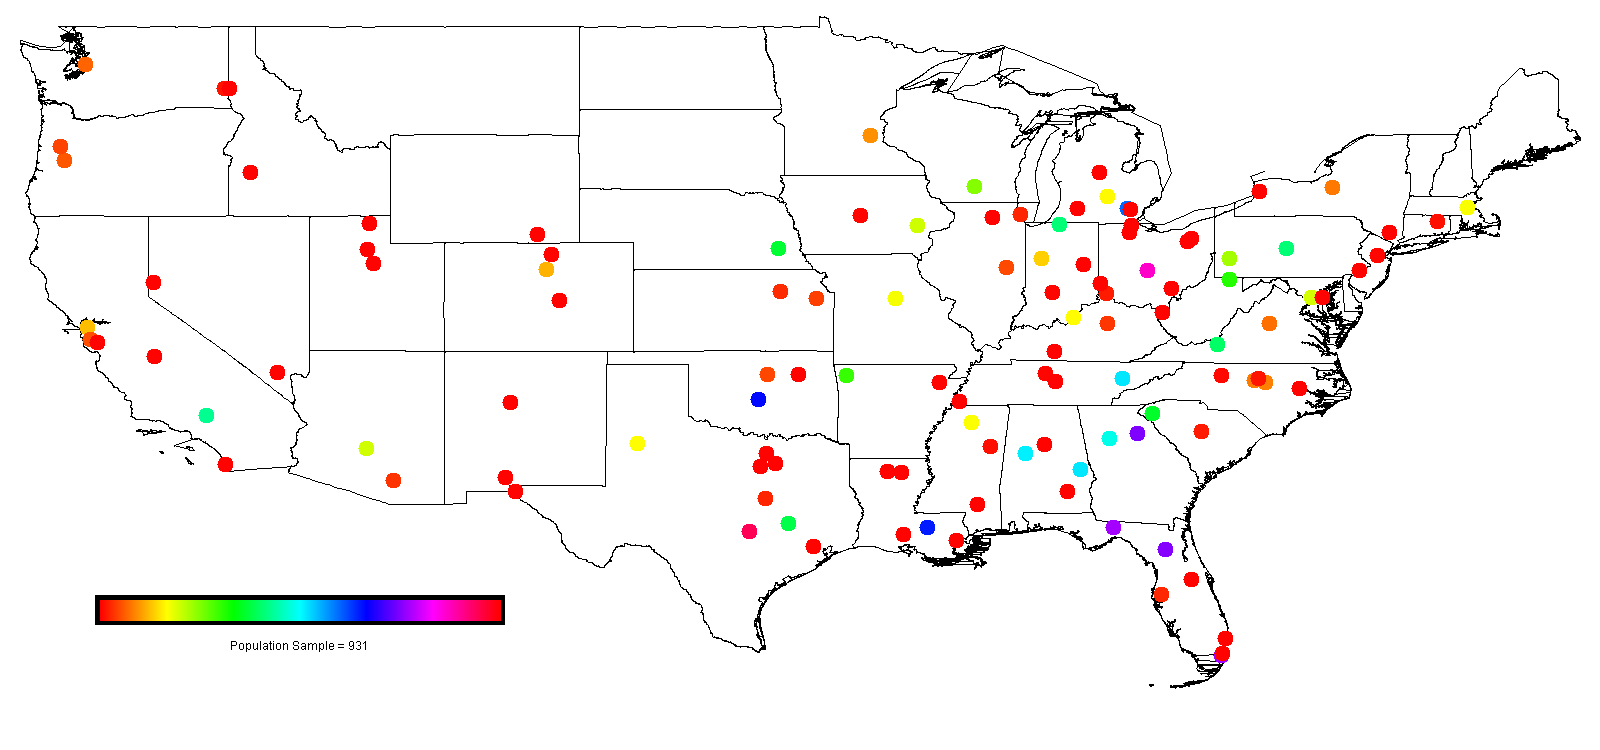
A note about the images. The circles indicate the number of recruits and location of the 120 schools. They're pretty straightforward except for when non-AQ schools are scaled to zero, then the images don't distinguish "good red" from "bad red". Keeping in mind that the top schools are all in the southeast should help you make sense of it, however.
Table I - Under and Overperformers (In-State Scalefactor = 1.5)
| Overperformers | Underperformers | About As Expected | |||||||||||||
| Rank | College | Expected | Actual | Difference | Rank | College | Expected | Actual | Difference | College | Expected | Actual | Difference | ||
| 1 | South Carolina | 0.87 | 17.71 | 16.84 | 1 | Georgia Tech | 27.25 | 7.46 | -19.80 | UCLA | 23.30 | 27.96 | 4.66 | ||
| 2 | Notre Dame | 23.68 | 40.08 | 16.40 | 2 | Nebraska | 21.13 | 7.46 | -13.67 | Michigan | 33.99 | 38.21 | 4.22 | ||
| 3 | North Carolina | 4.49 | 16.78 | 12.29 | 3 | West Virginia | 17.88 | 4.66 | -13.22 | Stanford | 2.77 | 6.52 | 3.75 | ||
| 4 | Florida | 41.24 | 52.19 | 10.95 | 4 | Virginia Tech | 22.64 | 11.18 | -11.46 | Colorado | 6.58 | 10.25 | 3.67 | ||
| 5 | Illinois | 2.61 | 13.05 | 10.44 | 5 | Texas A&M | 20.65 | 9.32 | -11.33 | Virginia | 4.01 | 7.46 | 3.44 | ||
| 6 | Alabama | 29.06 | 39.14 | 10.09 | 6 | Tennessee | 29.75 | 20.50 | -9.25 | Washington | 3.50 | 6.52 | 3.03 | ||
| 7 | Mississippi State | 0.44 | 10.25 | 9.81 | 7 | Ohio State | 48.65 | 40.08 | -8.58 | Pittsburgh | 12.66 | 14.91 | 2.25 | ||
| 8 | Oregon | 3.25 | 12.12 | 8.86 | 8 | Miami | 41.56 | 33.55 | -8.01 | Penn State | 22.95 | 25.16 | 2.22 | ||
| 9 | LSU | 36.89 | 45.67 | 8.77 | 9 | Arkansas | 17.19 | 9.32 | -7.87 | Duke | 0.63 | 2.80 | 2.16 | ||
| 10 | Oklahoma State | 2.57 | 11.18 | 8.61 | 10 | Purdue | 7.71 | 0.00 | -7.71 | South Florida | 1.31 | 2.80 | 1.48 | ||
| 11 | California | 6.66 | 14.91 | 8.25 | 11 | Wisconsin | 14.12 | 6.52 | -7.60 | Vanderbilt | 0.08 | 0.93 | 0.85 | ||
| 12 | Arizona | 1.80 | 9.32 | 7.52 | 12 | Florida State | 42.69 | 35.42 | -7.27 | Iowa State | 0.09 | 0.93 | 0.84 | ||
| 13 | Rutgers | 0.14 | 6.52 | 6.39 | 13 | Missouri | 9.86 | 2.80 | -7.06 | Baylor | 1.18 | 1.86 | 0.68 | ||
| 14 | Clemson | 20.48 | 26.10 | 5.61 | 14 | Louisville | 9.48 | 2.80 | -6.68 | Oregon State | 2.47 | 2.80 | 0.33 | ||
| 15 | Auburn | 29.40 | 23.30 | -6.10 | Kansas State | 1.54 | 1.86 | 0.32 | |||||||
| 16 | Oklahoma | 38.21 | 32.62 | -5.59 | Cincinnati | 0.84 | 0.93 | 0.09 | |||||||
| 17 | Texas Tech | 9.09 | 3.73 | -5.37 | Kentucky | 1.93 | 1.86 | -0.07 | |||||||
| Indiana | 0.09 | 0.00 | -0.09 | ||||||||||||
| Wake Forest | 0.21 | 0.00 | -0.21 | ||||||||||||
| Ole Miss | 9.55 | 9.32 | -0.23 | ||||||||||||
| Northwestern | 1.26 | 0.93 | -0.32 | ||||||||||||
| Connecticut | 0.46 | 0.00 | -0.46 | ||||||||||||
| Washington State | 0.63 | 0.00 | -0.63 | ||||||||||||
| NC State | 4.65 | 3.73 | -0.92 | ||||||||||||
| Arizona State | 11.29 | 10.25 | -1.04 | ||||||||||||
| Kansas | 2.30 | 0.93 | -1.37 | ||||||||||||
| USC | 54.58 | 53.12 | -1.46 | ||||||||||||
| Maryland | 10.87 | 9.32 | -1.55 | ||||||||||||
| Minnesota | 5.29 | 3.73 | -1.56 | ||||||||||||
| Georgia | 42.33 | 40.08 | -2.25 | ||||||||||||
| Michigan State | 9.22 | 6.52 | -2.69 | ||||||||||||
| Texas | 51.34 | 48.46 | -2.88 | ||||||||||||
| Boston College | 9.76 | 6.52 | -3.24 | ||||||||||||
| Syracuse | 4.42 | 0.00 | -4.42 | ||||||||||||
| Iowa | 11.46 | 6.52 | -4.93 | ||||||||||||
Table II - Actual vs. Modeled Number of Recruits, Teams Sorted Alphabetically
| College | 1.25 | 1.50 | 1.75 | 2.00 | Actual | College | 1.25 | 1.50 | 1.75 | 2.00 | Actual | |
| Alabama | 29.54 | 29.06 | 28.65 | 28.31 | 39.14 | NC State | 4.72 | 4.65 | 4.60 | 4.56 | 3.73 | |
| Arizona | 1.86 | 1.80 | 1.76 | 1.73 | 9.32 | Nebraska | 21.82 | 21.13 | 20.52 | 19.98 | 7.46 | |
| Arizona State | 11.61 | 11.29 | 11.07 | 10.91 | 10.25 | North Carolina | 4.55 | 4.49 | 4.44 | 4.40 | 16.78 | |
| Arkansas | 17.71 | 17.19 | 16.75 | 16.36 | 9.32 | Northwestern | 1.27 | 1.26 | 1.25 | 1.24 | 0.93 | |
| Auburn | 29.96 | 29.40 | 28.91 | 28.50 | 23.30 | Notre Dame | 24.35 | 23.68 | 23.07 | 22.53 | 40.08 | |
| Baylor | 1.14 | 1.18 | 1.23 | 1.26 | 1.86 | Ohio State | 48.57 | 48.65 | 48.77 | 48.92 | 40.08 | |
| Boston College | 10.05 | 9.76 | 9.50 | 9.26 | 6.52 | Oklahoma | 39.39 | 38.21 | 37.18 | 36.28 | 32.62 | |
| California | 6.41 | 6.66 | 6.86 | 7.02 | 14.91 | Oklahoma State | 2.65 | 2.57 | 2.51 | 2.45 | 11.18 | |
| Cincinnati | 0.84 | 0.84 | 0.84 | 0.84 | 0.93 | Ole Miss | 9.74 | 9.55 | 9.41 | 9.29 | 9.32 | |
| Clemson | 20.79 | 20.48 | 20.24 | 20.05 | 26.10 | Oregon | 3.42 | 3.25 | 3.11 | 2.99 | 12.12 | |
| Colorado | 6.71 | 6.58 | 6.50 | 6.44 | 10.25 | Oregon State | 2.59 | 2.47 | 2.36 | 2.27 | 2.80 | |
| Connecticut | 0.47 | 0.46 | 0.45 | 0.44 | 0.00 | Penn State | 22.90 | 22.95 | 23.01 | 23.09 | 25.16 | |
| Duke | 0.64 | 0.63 | 0.62 | 0.62 | 2.80 | Pittsburgh | 12.66 | 12.66 | 12.68 | 12.70 | 14.91 | |
| Florida | 39.88 | 41.24 | 42.38 | 43.35 | 52.19 | Purdue | 7.93 | 7.71 | 7.51 | 7.33 | 0.00 | |
| Florida State | 41.72 | 42.69 | 43.49 | 44.16 | 35.42 | Rutgers | 0.14 | 0.14 | 0.14 | 0.14 | 6.52 | |
| Georgia | 42.52 | 42.33 | 42.20 | 42.11 | 40.08 | South Carolina | 0.88 | 0.87 | 0.87 | 0.86 | 17.71 | |
| Georgia Tech | 27.33 | 27.25 | 27.22 | 27.20 | 7.46 | South Florida | 1.26 | 1.31 | 1.36 | 1.40 | 2.80 | |
| Illinois | 2.65 | 2.61 | 2.57 | 2.54 | 13.05 | Stanford | 2.66 | 2.77 | 2.85 | 2.92 | 6.52 | |
| Indiana | 0.09 | 0.09 | 0.08 | 0.08 | 0.00 | Syracuse | 4.52 | 4.42 | 4.34 | 4.26 | 0.00 | |
| Iowa | 11.82 | 11.46 | 11.14 | 10.85 | 6.52 | Tennessee | 30.64 | 29.75 | 28.97 | 28.27 | 20.50 | |
| Iowa State | 0.10 | 0.09 | 0.09 | 0.09 | 0.93 | Texas | 49.40 | 51.34 | 53.10 | 54.69 | 48.46 | |
| Kansas | 2.38 | 2.30 | 2.23 | 2.17 | 0.93 | Texas A&M | 19.85 | 20.65 | 21.38 | 22.04 | 9.32 | |
| Kansas State | 1.60 | 1.54 | 1.49 | 1.45 | 1.86 | Texas Tech | 8.92 | 9.09 | 9.26 | 9.42 | 3.73 | |
| Kentucky | 1.99 | 1.93 | 1.87 | 1.82 | 1.86 | UCLA | 22.36 | 23.30 | 24.03 | 24.62 | 27.96 | |
| Louisville | 9.78 | 9.48 | 9.21 | 8.96 | 2.80 | USC | 52.42 | 54.58 | 56.26 | 57.60 | 53.12 | |
| LSU | 37.43 | 36.89 | 36.47 | 36.12 | 45.67 | Vanderbilt | 0.08 | 0.08 | 0.08 | 0.08 | 0.93 | |
| Maryland | 10.90 | 10.87 | 10.87 | 10.89 | 9.32 | Virginia | 4.04 | 4.01 | 4.00 | 3.99 | 7.46 | |
| Miami | 39.60 | 41.56 | 43.21 | 44.63 | 33.55 | Virginia Tech | 22.96 | 22.64 | 22.39 | 22.17 | 11.18 | |
| Michigan | 34.36 | 33.99 | 33.66 | 33.37 | 38.21 | Wake Forest | 0.21 | 0.21 | 0.20 | 0.20 | 0.00 | |
| Michigan State | 9.33 | 9.22 | 9.12 | 9.03 | 6.52 | Washington | 3.42 | 3.50 | 3.59 | 3.68 | 6.52 | |
| Minnesota | 5.38 | 5.29 | 5.21 | 5.15 | 3.73 | Washington State | 0.64 | 0.63 | 0.63 | 0.63 | 0.00 | |
| Mississippi State | 0.45 | 0.44 | 0.43 | 0.43 | 10.25 | West Virginia | 18.42 | 17.88 | 17.38 | 16.92 | 4.66 | |
| Missouri | 10.12 | 9.86 | 9.62 | 9.42 | 2.80 | Wisconsin | 14.49 | 14.12 | 13.79 | 13.50 | 6.52 | |
| Total Deviation from Actual | 370.98 | 370.07 | 370.47 | 370.92 | ||||||||
Table III - Recruiting Ranking, Actual vs. Modeled, Teams Sorted Alphabetically
| College | 1.25 | 1.50 | 1.75 | 2.00 | Actual | College | 1.25 | 1.50 | 1.75 | 2.00 | Actual | |
| Alabama | 13 | 13 | 13 | 12 | 8 | NC State | 39 | 39 | 39 | 39 | 46 | |
| Arizona | 51 | 51 | 51 | 51 | 29 | Nebraska | 19 | 19 | 20 | 21 | 35 | |
| Arizona State | 27 | 27 | 27 | 26 | 26 | North Carolina | 40 | 40 | 40 | 40 | 19 | |
| Arkansas | 23 | 23 | 23 | 23 | 30 | Northwestern | 53 | 54 | 54 | 55 | 62 | |
| Auburn | 12 | 12 | 12 | 11 | 16 | Notre Dame | 15 | 15 | 16 | 17 | 6 | |
| Baylor | 55 | 55 | 55 | 54 | 53 | Ohio State | 3 | 3 | 3 | 3 | 6 | |
| Boston College | 30 | 30 | 30 | 32 | 37 | Oklahoma | 8 | 8 | 8 | 8 | 12 | |
| California | 37 | 36 | 36 | 36 | 20 | Oklahoma State | 47 | 47 | 47 | 47 | 24 | |
| Cincinnati | 57 | 57 | 57 | 57 | 58 | Ole Miss | 32 | 31 | 31 | 31 | 32 | |
| Clemson | 20 | 21 | 21 | 20 | 14 | Oregon | 43 | 44 | 44 | 44 | 23 | |
| Colorado | 36 | 37 | 37 | 37 | 27 | Oregon State | 48 | 48 | 48 | 48 | 51 | |
| Connecticut | 60 | 60 | 60 | 60 | 68 | Penn State | 17 | 17 | 17 | 16 | 15 | |
| Duke | 58 | 59 | 59 | 59 | 48 | Pittsburgh | 25 | 25 | 25 | 25 | 21 | |
| Florida | 6 | 7 | 6 | 6 | 2 | Purdue | 35 | 35 | 35 | 35 | 68 | |
| Florida State | 5 | 4 | 4 | 5 | 10 | Rutgers | 63 | 63 | 63 | 63 | 40 | |
| Georgia | 4 | 5 | 7 | 7 | 5 | South Carolina | 56 | 56 | 56 | 56 | 18 | |
| Georgia Tech | 14 | 14 | 14 | 14 | 34 | South Florida | 54 | 53 | 53 | 53 | 52 | |
| Illinois | 46 | 46 | 46 | 46 | 22 | Stanford | 45 | 45 | 45 | 45 | 41 | |
| Indiana | 65 | 65 | 65 | 65 | 68 | Syracuse | 41 | 41 | 41 | 41 | 68 | |
| Iowa | 26 | 26 | 26 | 28 | 38 | Tennessee | 11 | 11 | 11 | 13 | 17 | |
| Iowa State | 64 | 64 | 64 | 64 | 60 | Texas | 2 | 2 | 2 | 2 | 3 | |
| Kansas | 49 | 49 | 49 | 49 | 61 | Texas A&M | 21 | 20 | 19 | 19 | 33 | |
| Kansas State | 52 | 52 | 52 | 52 | 54 | Texas Tech | 34 | 34 | 32 | 30 | 47 | |
| Kentucky | 50 | 50 | 50 | 50 | 55 | UCLA | 18 | 16 | 15 | 15 | 13 | |
| Louisville | 31 | 32 | 33 | 34 | 49 | USC | 1 | 1 | 1 | 1 | 1 | |
| LSU | 9 | 9 | 9 | 9 | 4 | Vanderbilt | 66 | 66 | 66 | 66 | 68 | |
| Maryland | 28 | 28 | 28 | 27 | 31 | Virginia | 42 | 42 | 42 | 42 | 36 | |
| Miami | 7 | 6 | 5 | 4 | 11 | Virginia Tech | 16 | 18 | 18 | 18 | 25 | |
| Michigan | 10 | 10 | 10 | 10 | 9 | Wake Forest | 62 | 62 | 62 | 62 | 68 | |
| Michigan State | 33 | 33 | 34 | 33 | 39 | Washington | 44 | 43 | 43 | 43 | 42 | |
| Minnesota | 38 | 38 | 38 | 38 | 45 | Washington State | 59 | 58 | 58 | 58 | 68 | |
| Mississippi State | 61 | 61 | 61 | 61 | 28 | West Virginia | 22 | 22 | 22 | 22 | 44 | |
| Missouri | 29 | 29 | 29 | 29 | 50 | Wisconsin | 24 | 24 | 24 | 24 | 43 |
Table IV - Rankings for Each Scale Factor
| Scale Factor = 1.25 | Scale Factor = 1.50 | Scale Factor = 1.75 | Scale Factor = 2.00 | |||||||||||
| Rank | College | Recruits | Rank | College | Recruits | Rank | College | Recruits | Rank | College | Recruits | |||
| 1 | USC | 52.42 | 1 | USC | 54.58 | 1 | USC | 56.26 | 1 | USC | 57.60 | |||
| 2 | Texas | 49.40 | 2 | Texas | 51.34 | 2 | Texas | 53.10 | 2 | Texas | 54.69 | |||
| 3 | Ohio State | 48.57 | 3 | Ohio State | 48.65 | 3 | Ohio State | 48.77 | 3 | Ohio State | 48.92 | |||
| 4 | Georgia | 42.52 | 4 | Florida State | 42.69 | 4 | Florida State | 43.49 | 4 | Miami | 44.63 | |||
| 5 | Florida State | 41.72 | 5 | Georgia | 42.33 | 5 | Miami | 43.21 | 5 | Florida State | 44.16 | |||
| 6 | Florida | 39.88 | 6 | Miami | 41.56 | 6 | Florida | 42.38 | 6 | Florida | 43.35 | |||
| 7 | Miami | 39.60 | 7 | Florida | 41.24 | 7 | Georgia | 42.20 | 7 | Georgia | 42.11 | |||
| 8 | Oklahoma | 39.39 | 8 | Oklahoma | 38.21 | 8 | Oklahoma | 37.18 | 8 | Oklahoma | 36.28 | |||
| 9 | LSU | 37.43 | 9 | LSU | 36.89 | 9 | LSU | 36.47 | 9 | LSU | 36.12 | |||
| 10 | Michigan | 34.36 | 10 | Michigan | 33.99 | 10 | Michigan | 33.66 | 10 | Michigan | 33.37 | |||
| 11 | Tennessee | 30.64 | 11 | Tennessee | 29.75 | 11 | Tennessee | 28.97 | 11 | Auburn | 28.50 | |||
| 12 | Auburn | 29.96 | 12 | Auburn | 29.40 | 12 | Auburn | 28.91 | 12 | Alabama | 28.31 | |||
| 13 | Alabama | 29.54 | 13 | Alabama | 29.06 | 13 | Alabama | 28.65 | 13 | Tennessee | 28.27 | |||
| 14 | Georgia Tech | 27.33 | 14 | Georgia Tech | 27.25 | 14 | Georgia Tech | 27.22 | 14 | Georgia Tech | 27.20 | |||
| 15 | Notre Dame | 24.35 | 15 | Notre Dame | 23.68 | 15 | UCLA | 24.03 | 15 | UCLA | 24.62 | |||
| 16 | Virginia Tech | 22.96 | 16 | UCLA | 23.30 | 16 | Notre Dame | 23.07 | 16 | Penn State | 23.09 | |||
| 17 | Penn State | 22.90 | 17 | Penn State | 22.95 | 17 | Penn State | 23.01 | 17 | Notre Dame | 22.53 | |||
| 18 | UCLA | 22.36 | 18 | Virginia Tech | 22.64 | 18 | Virginia Tech | 22.39 | 18 | Virginia Tech | 22.17 | |||
| 19 | Nebraska | 21.82 | 19 | Nebraska | 21.13 | 19 | Texas A&M | 21.38 | 19 | Texas A&M | 22.04 | |||
| 20 | Clemson | 20.79 | 20 | Texas A&M | 20.65 | 20 | Nebraska | 20.52 | 20 | Clemson | 20.05 | |||
| 21 | Texas A&M | 19.85 | 21 | Clemson | 20.48 | 21 | Clemson | 20.24 | 21 | Nebraska | 19.98 | |||
| 22 | West Virginia | 18.42 | 22 | West Virginia | 17.88 | 22 | West Virginia | 17.38 | 22 | West Virginia | 16.92 | |||
| 23 | Arkansas | 17.71 | 23 | Arkansas | 17.19 | 23 | Arkansas | 16.75 | 23 | Arkansas | 16.36 | |||
| 24 | Wisconsin | 14.49 | 24 | Wisconsin | 14.12 | 24 | Wisconsin | 13.79 | 24 | Wisconsin | 13.50 | |||
| 25 | Pittsburgh | 12.66 | 25 | Pittsburgh | 12.66 | 25 | Pittsburgh | 12.68 | 25 | Pittsburgh | 12.70 | |||
| 26 | Iowa | 11.82 | 26 | Iowa | 11.46 | 26 | Iowa | 11.14 | 26 | Arizona State | 10.91 | |||
| 27 | Arizona State | 11.61 | 27 | Arizona State | 11.29 | 27 | Arizona State | 11.07 | 27 | Maryland | 10.89 | |||
| 28 | Maryland | 10.90 | 28 | Maryland | 10.87 | 28 | Maryland | 10.87 | 28 | Iowa | 10.85 | |||
| 29 | Missouri | 10.12 | 29 | Missouri | 9.86 | 29 | Missouri | 9.62 | 29 | Missouri | 9.42 | |||
| 30 | Boston College | 10.05 | 30 | Boston College | 9.76 | 30 | Boston College | 9.50 | 30 | Texas Tech | 9.42 | |||
| 31 | Louisville | 9.78 | 31 | Ole Miss | 9.55 | 31 | Ole Miss | 9.41 | 31 | Ole Miss | 9.29 | |||
| 32 | Ole Miss | 9.74 | 32 | Louisville | 9.48 | 32 | Texas Tech | 9.26 | 32 | Boston College | 9.26 | |||
| 33 | Michigan State | 9.33 | 33 | Michigan State | 9.22 | 33 | Louisville | 9.21 | 33 | Michigan State | 9.03 | |||
| 34 | Texas Tech | 8.92 | 34 | Texas Tech | 9.09 | 34 | Michigan State | 9.12 | 34 | Louisville | 8.96 | |||
| 35 | Purdue | 7.93 | 35 | Purdue | 7.71 | 35 | Purdue | 7.51 | 35 | Purdue | 7.33 | |||
| 36 | Colorado | 6.71 | 36 | California | 6.66 | 36 | California | 6.86 | 36 | California | 7.02 | |||
| 37 | California | 6.41 | 37 | Colorado | 6.58 | 37 | Colorado | 6.50 | 37 | Colorado | 6.44 | |||
| 38 | Minnesota | 5.38 | 38 | Minnesota | 5.29 | 38 | Minnesota | 5.21 | 38 | Minnesota | 5.15 | |||
| 39 | NC State | 4.72 | 39 | NC State | 4.65 | 39 | NC State | 4.60 | 39 | NC State | 4.56 | |||
| 40 | North Carolina | 4.55 | 40 | North Carolina | 4.49 | 40 | North Carolina | 4.44 | 40 | North Carolina | 4.40 | |||
| 41 | Syracuse | 4.52 | 41 | Syracuse | 4.42 | 41 | Syracuse | 4.34 | 41 | Syracuse | 4.26 | |||
| 42 | Virginia | 4.04 | 42 | Virginia | 4.01 | 42 | Virginia | 4.00 | 42 | Virginia | 3.99 | |||
| 43 | Oregon | 3.42 | 43 | Washington | 3.50 | 43 | Washington | 3.59 | 43 | Washington | 3.68 | |||
| 44 | Washington | 3.42 | 44 | Oregon | 3.25 | 44 | Oregon | 3.11 | 44 | Oregon | 2.99 | |||
| 45 | Stanford | 2.66 | 45 | Stanford | 2.77 | 45 | Stanford | 2.85 | 45 | Stanford | 2.92 | |||
| 46 | Illinois | 2.65 | 46 | Illinois | 2.61 | 46 | Illinois | 2.57 | 46 | Illinois | 2.54 | |||
| 47 | Oklahoma State | 2.65 | 47 | Oklahoma State | 2.57 | 47 | Oklahoma State | 2.51 | 47 | Oklahoma State | 2.45 | |||
| 48 | Oregon State | 2.59 | 48 | Oregon State | 2.47 | 48 | Oregon State | 2.36 | 48 | Oregon State | 2.27 | |||
| 49 | Kansas | 2.38 | 49 | Kansas | 2.30 | 49 | Kansas | 2.23 | 49 | Kansas | 2.17 | |||
| 50 | Kentucky | 1.99 | 50 | Kentucky | 1.93 | 50 | Kentucky | 1.87 | 50 | Kentucky | 1.82 | |||
| 51 | Arizona | 1.86 | 51 | Arizona | 1.80 | 51 | Arizona | 1.76 | 51 | Arizona | 1.73 | |||
| 52 | Kansas State | 1.60 | 52 | Kansas State | 1.54 | 52 | Kansas State | 1.49 | 52 | Kansas State | 1.45 | |||
| 53 | Northwestern | 1.27 | 53 | South Florida | 1.31 | 53 | South Florida | 1.36 | 53 | South Florida | 1.40 | |||
| 54 | South Florida | 1.26 | 54 | Northwestern | 1.26 | 54 | Northwestern | 1.25 | 54 | Baylor | 1.26 | |||
| 55 | Baylor | 1.14 | 55 | Baylor | 1.18 | 55 | Baylor | 1.23 | 55 | Northwestern | 1.24 | |||
| 56 | South Carolina | 0.88 | 56 | South Carolina | 0.87 | 56 | South Carolina | 0.87 | 56 | South Carolina | 0.86 | |||
| 57 | Cincinnati | 0.84 | 57 | Cincinnati | 0.84 | 57 | Cincinnati | 0.84 | 57 | Cincinnati | 0.84 | |||
| 58 | Duke | 0.64 | 58 | Washington State | 0.63 | 58 | Washington State | 0.63 | 58 | Washington State | 0.63 | |||
| 59 | Washington State | 0.64 | 59 | Duke | 0.63 | 59 | Duke | 0.62 | 59 | Duke | 0.62 | |||
| 60 | Connecticut | 0.47 | 60 | Connecticut | 0.46 | 60 | Connecticut | 0.45 | 60 | Connecticut | 0.44 | |||
| 61 | Mississippi State | 0.45 | 61 | Mississippi State | 0.44 | 61 | Mississippi State | 0.43 | 61 | Mississippi State | 0.43 | |||
| 62 | Wake Forest | 0.21 | 62 | Wake Forest | 0.21 | 62 | Wake Forest | 0.20 | 62 | Wake Forest | 0.20 | |||
| 63 | Rutgers | 0.14 | 63 | Rutgers | 0.14 | 63 | Rutgers | 0.14 | 63 | Rutgers | 0.14 | |||
| 64 | Iowa State | 0.10 | 64 | Iowa State | 0.09 | 64 | Iowa State | 0.09 | 64 | Iowa State | 0.09 | |||
| 65 | Indiana | 0.09 | 65 | Indiana | 0.09 | 65 | Indiana | 0.08 | 65 | Indiana | 0.08 | |||
| 66 | Vanderbilt | 0.08 | 66 | Vanderbilt | 0.08 | 66 | Vanderbilt | 0.08 | 66 | Vanderbilt | 0.08 | |||
| 67 | Air Force | 0.00 | 67 | Air Force | 0.00 | 67 | Air Force | 0.00 | 67 | Air Force | 0.00 | |||
| 68 | Akron | 0.00 | 68 | Akron | 0.00 | 68 | Akron | 0.00 | 68 | Akron | 0.00 | |||
| 69 | Arkansas State | 0.00 | 69 | Arkansas State | 0.00 | 69 | Arkansas State | 0.00 | 69 | Arkansas State | 0.00 | |||
| 70 | Army | 0.00 | 70 | Army | 0.00 | 70 | Army | 0.00 | 70 | Army | 0.00 | |||
| 71 | Ball State | 0.00 | 71 | Ball State | 0.00 | 71 | Ball State | 0.00 | 71 | Ball State | 0.00 | |||
| 72 | Boise State | 0.00 | 72 | Boise State | 0.00 | 72 | Boise State | 0.00 | 72 | Boise State | 0.00 | |||
| 73 | Bowling Green | 0.00 | 73 | Bowling Green | 0.00 | 73 | Bowling Green | 0.00 | 73 | Bowling Green | 0.00 | |||
| 74 | Buffalo | 0.00 | 74 | Buffalo | 0.00 | 74 | Buffalo | 0.00 | 74 | Buffalo | 0.00 | |||
| 75 | BYU | 0.00 | 75 | BYU | 0.00 | 75 | BYU | 0.00 | 75 | BYU | 0.00 | |||
| 76 | Central Michigan | 0.00 | 76 | Central Michigan | 0.00 | 76 | Central Michigan | 0.00 | 76 | Central Michigan | 0.00 | |||
| 77 | Colorado State | 0.00 | 77 | Colorado State | 0.00 | 77 | Colorado State | 0.00 | 77 | Colorado State | 0.00 | |||
| 78 | Eastern Michigan | 0.00 | 78 | Eastern Michigan | 0.00 | 78 | Eastern Michigan | 0.00 | 78 | Eastern Michigan | 0.00 | |||
| 79 | ECU | 0.00 | 79 | ECU | 0.00 | 79 | ECU | 0.00 | 79 | ECU | 0.00 | |||
| 80 | FIU | 0.00 | 80 | FIU | 0.00 | 80 | FIU | 0.00 | 80 | FIU | 0.00 | |||
| 81 | Florida Atlantic | 0.00 | 81 | Florida Atlantic | 0.00 | 81 | Florida Atlantic | 0.00 | 81 | Florida Atlantic | 0.00 | |||
| 82 | Fresno State | 0.00 | 82 | Fresno State | 0.00 | 82 | Fresno State | 0.00 | 82 | Fresno State | 0.00 | |||
| 83 | Hawaii | 0.00 | 83 | Hawaii | 0.00 | 83 | Hawaii | 0.00 | 83 | Hawaii | 0.00 | |||
| 84 | Houston | 0.00 | 84 | Houston | 0.00 | 84 | Houston | 0.00 | 84 | Houston | 0.00 | |||
| 85 | Idaho | 0.00 | 85 | Idaho | 0.00 | 85 | Idaho | 0.00 | 85 | Idaho | 0.00 | |||
| 86 | Kent State | 0.00 | 86 | Kent State | 0.00 | 86 | Kent State | 0.00 | 86 | Kent State | 0.00 | |||
| 87 | Louisiana Tech | 0.00 | 87 | Louisiana Tech | 0.00 | 87 | Louisiana Tech | 0.00 | 87 | Louisiana Tech | 0.00 | |||
| 88 | Louisiana-Lafayette | 0.00 | 88 | Louisiana-Lafayette | 0.00 | 88 | Louisiana-Lafayette | 0.00 | 88 | Louisiana-Lafayette | 0.00 | |||
| 89 | Louisiana-Monroe | 0.00 | 89 | Louisiana-Monroe | 0.00 | 89 | Louisiana-Monroe | 0.00 | 89 | Louisiana-Monroe | 0.00 | |||
| 90 | Marshall | 0.00 | 90 | Marshall | 0.00 | 90 | Marshall | 0.00 | 90 | Marshall | 0.00 | |||
| 91 | Memphis | 0.00 | 91 | Memphis | 0.00 | 91 | Memphis | 0.00 | 91 | Memphis | 0.00 | |||
| 92 | Miami (OH) | 0.00 | 92 | Miami (OH) | 0.00 | 92 | Miami (OH) | 0.00 | 92 | Miami (OH) | 0.00 | |||
| 93 | Middle Tennessee | 0.00 | 93 | Middle Tennessee | 0.00 | 93 | Middle Tennessee | 0.00 | 93 | Middle Tennessee | 0.00 | |||
| 94 | Navy | 0.00 | 94 | Navy | 0.00 | 94 | Navy | 0.00 | 94 | Navy | 0.00 | |||
| 95 | Nevada | 0.00 | 95 | Nevada | 0.00 | 95 | Nevada | 0.00 | 95 | Nevada | 0.00 | |||
| 96 | New Mexico | 0.00 | 96 | New Mexico | 0.00 | 96 | New Mexico | 0.00 | 96 | New Mexico | 0.00 | |||
| 97 | New Mexico State | 0.00 | 97 | New Mexico State | 0.00 | 97 | New Mexico State | 0.00 | 97 | New Mexico State | 0.00 | |||
| 98 | North Texas | 0.00 | 98 | North Texas | 0.00 | 98 | North Texas | 0.00 | 98 | North Texas | 0.00 | |||
| 99 | Northern Illinois | 0.00 | 99 | Northern Illinois | 0.00 | 99 | Northern Illinois | 0.00 | 99 | Northern Illinois | 0.00 | |||
| 100 | Ohio | 0.00 | 100 | Ohio | 0.00 | 100 | Ohio | 0.00 | 100 | Ohio | 0.00 | |||
| 101 | Rice | 0.00 | 101 | Rice | 0.00 | 101 | Rice | 0.00 | 101 | Rice | 0.00 | |||
| 102 | San Diego State | 0.00 | 102 | San Diego State | 0.00 | 102 | San Diego State | 0.00 | 102 | San Diego State | 0.00 | |||
| 103 | San Jose State | 0.00 | 103 | San Jose State | 0.00 | 103 | San Jose State | 0.00 | 103 | San Jose State | 0.00 | |||
| 104 | SMU | 0.00 | 104 | SMU | 0.00 | 104 | SMU | 0.00 | 104 | SMU | 0.00 | |||
| 105 | Southern Miss | 0.00 | 105 | Southern Miss | 0.00 | 105 | Southern Miss | 0.00 | 105 | Southern Miss | 0.00 | |||
| 106 | TCU | 0.00 | 106 | TCU | 0.00 | 106 | TCU | 0.00 | 106 | TCU | 0.00 | |||
| 107 | Temple | 0.00 | 107 | Temple | 0.00 | 107 | Temple | 0.00 | 107 | Temple | 0.00 | |||
| 108 | Toledo | 0.00 | 108 | Toledo | 0.00 | 108 | Toledo | 0.00 | 108 | Toledo | 0.00 | |||
| 109 | Troy | 0.00 | 109 | Troy | 0.00 | 109 | Troy | 0.00 | 109 | Troy | 0.00 | |||
| 110 | Tulane | 0.00 | 110 | Tulane | 0.00 | 110 | Tulane | 0.00 | 110 | Tulane | 0.00 | |||
| 111 | Tulsa | 0.00 | 111 | Tulsa | 0.00 | 111 | Tulsa | 0.00 | 111 | Tulsa | 0.00 | |||
| 112 | UAB | 0.00 | 112 | UAB | 0.00 | 112 | UAB | 0.00 | 112 | UAB | 0.00 | |||
| 113 | UCF | 0.00 | 113 | UCF | 0.00 | 113 | UCF | 0.00 | 113 | UCF | 0.00 | |||
| 114 | UNLV | 0.00 | 114 | UNLV | 0.00 | 114 | UNLV | 0.00 | 114 | UNLV | 0.00 | |||
| 115 | Utah | 0.00 | 115 | Utah | 0.00 | 115 | Utah | 0.00 | 115 | Utah | 0.00 | |||
| 116 | Utah State | 0.00 | 116 | Utah State | 0.00 | 116 | Utah State | 0.00 | 116 | Utah State | 0.00 | |||
| 117 | UTEP | 0.00 | 117 | UTEP | 0.00 | 117 | UTEP | 0.00 | 117 | UTEP | 0.00 | |||
| 118 | Western Kentucky | 0.00 | 118 | Western Kentucky | 0.00 | 118 | Western Kentucky | 0.00 | 118 | Western Kentucky | 0.00 | |||
| 119 | Western Michigan | 0.00 | 119 | Western Michigan | 0.00 | 119 | Western Michigan | 0.00 | 119 | Western Michigan | 0.00 | |||
| 120 | Wyoming | 0.00 | 120 | Wyoming | 0.00 | 120 | Wyoming | 0.00 | 120 | Wyoming | 0.00 |


Added 03/25/2010