Case 3: 2006 - 2009 Rivals 250 Lists as Population Source
In this analysis, the population sample was the last four years of the Rivals 250 list which ranks the top high school prospects in the country. All told, my town-lookup script found locations for 929 of the 1000 listed players. It's important to note that I used the same decay function as in Case 2 that I derived from the much larger sample of ALL college players rather than derive a new one (see Calculating Populations for details). This assumes that highly-touted recruits generally have the same geographic preferences for schools (probably not entirely true) and takes advantage of the 13 times larger sample size for all of the recruits. This is something I'll probably revisit in the future.
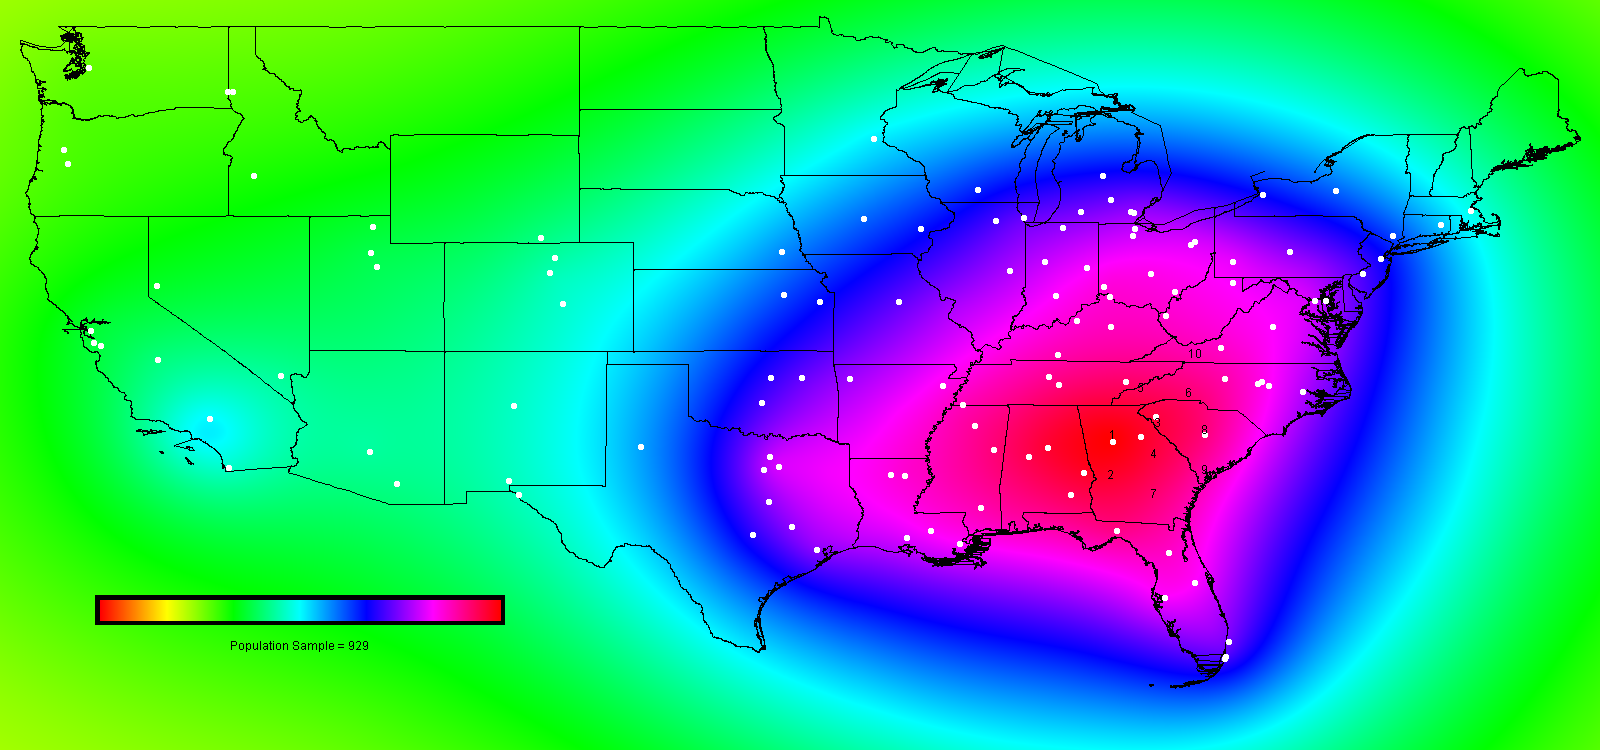
In the first figure, before colleges are used as negative population sources, that the strongest recruiting area appears to be a corridor from Georgia north to Virginia a few hundred miles inland (perhaps Virginia Tech isn't so inconveniently located in Blacksburg after all) feeding the SEC and ACC schools and probably explaining the abundance of NFL players from those two leagues.
As in Case 2, this is surprising given the emphasis placed on Texas and Florida. To rehash my arguments from that page, there are a couple ways to explain this: 1.) each of these states is naturally overhyped due to its large population and land mass--looking through a roster and seeing that there are many players from Texas sticks out much more then recalling all recruits from Ohio, Kentucky, and Tennessee which sum to a similar population as Texas over a smaller geographic area (hence less dilution). The second contributing factor is that Texas and Florida lack southerly neighbors to contribute to their effective populations. UWash again falls to the bottom of the list (this seems to be the norm given their location in the northwest corner of the country). The rest of the west coast also suffers in this list.
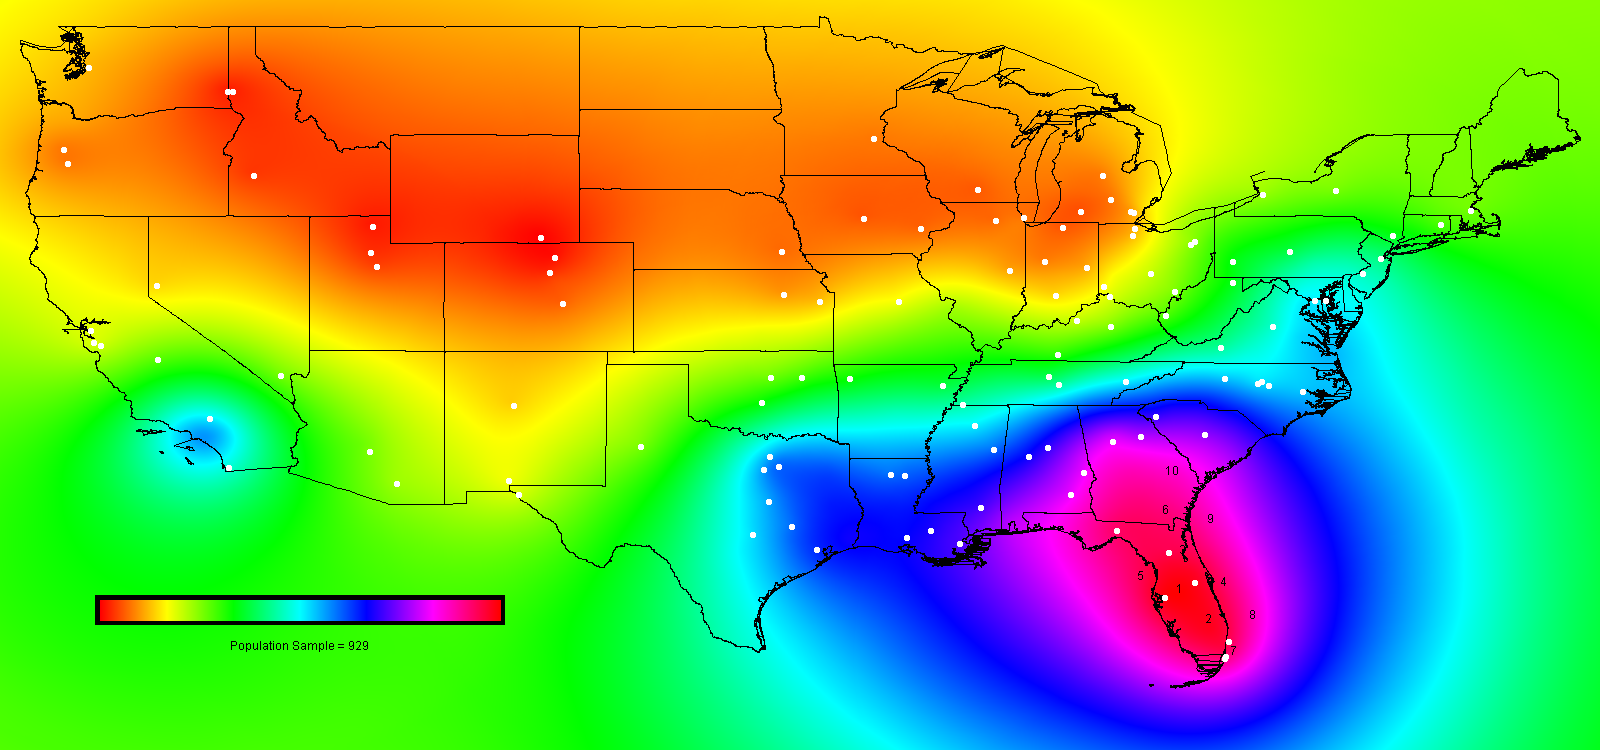
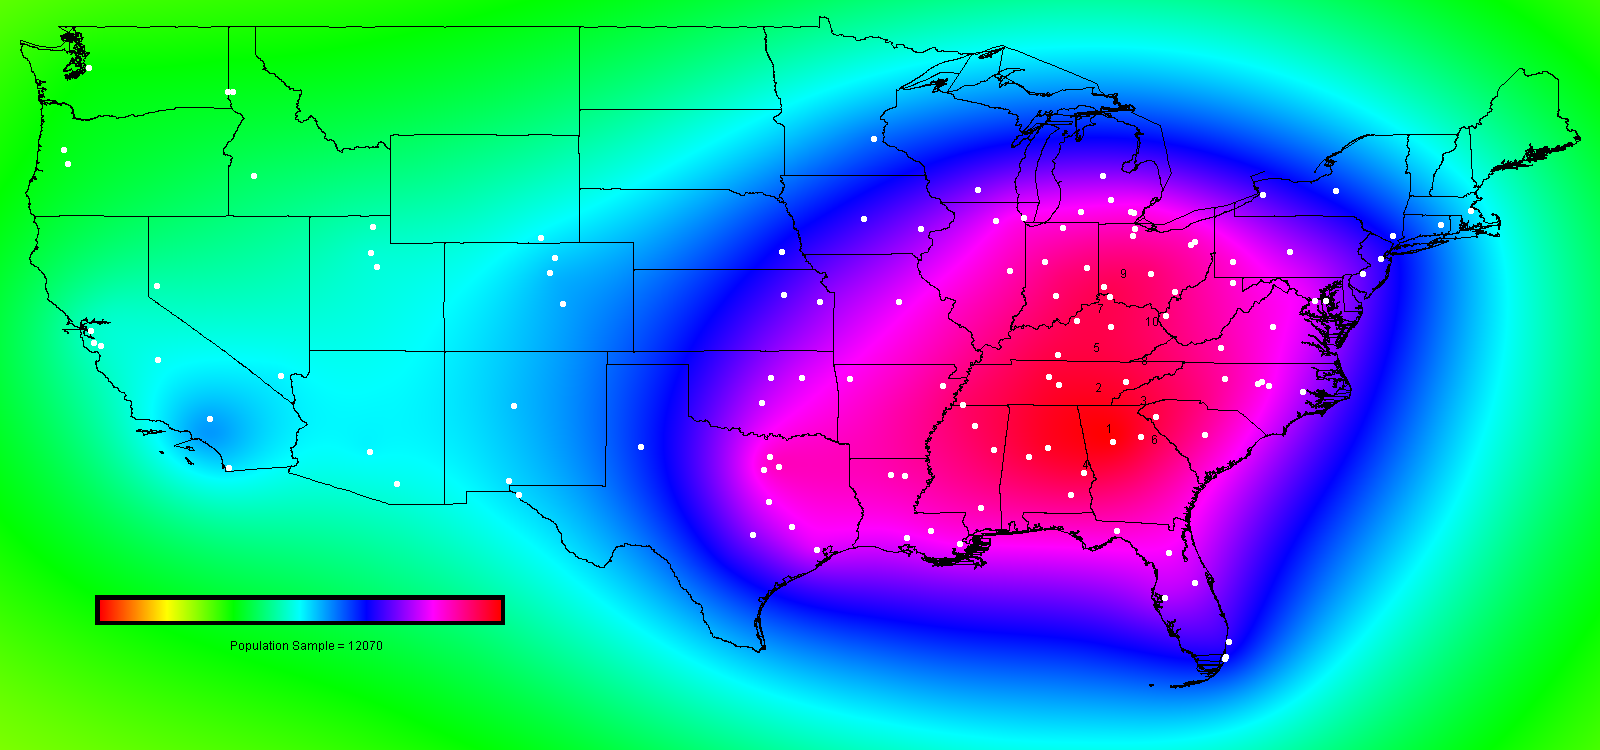
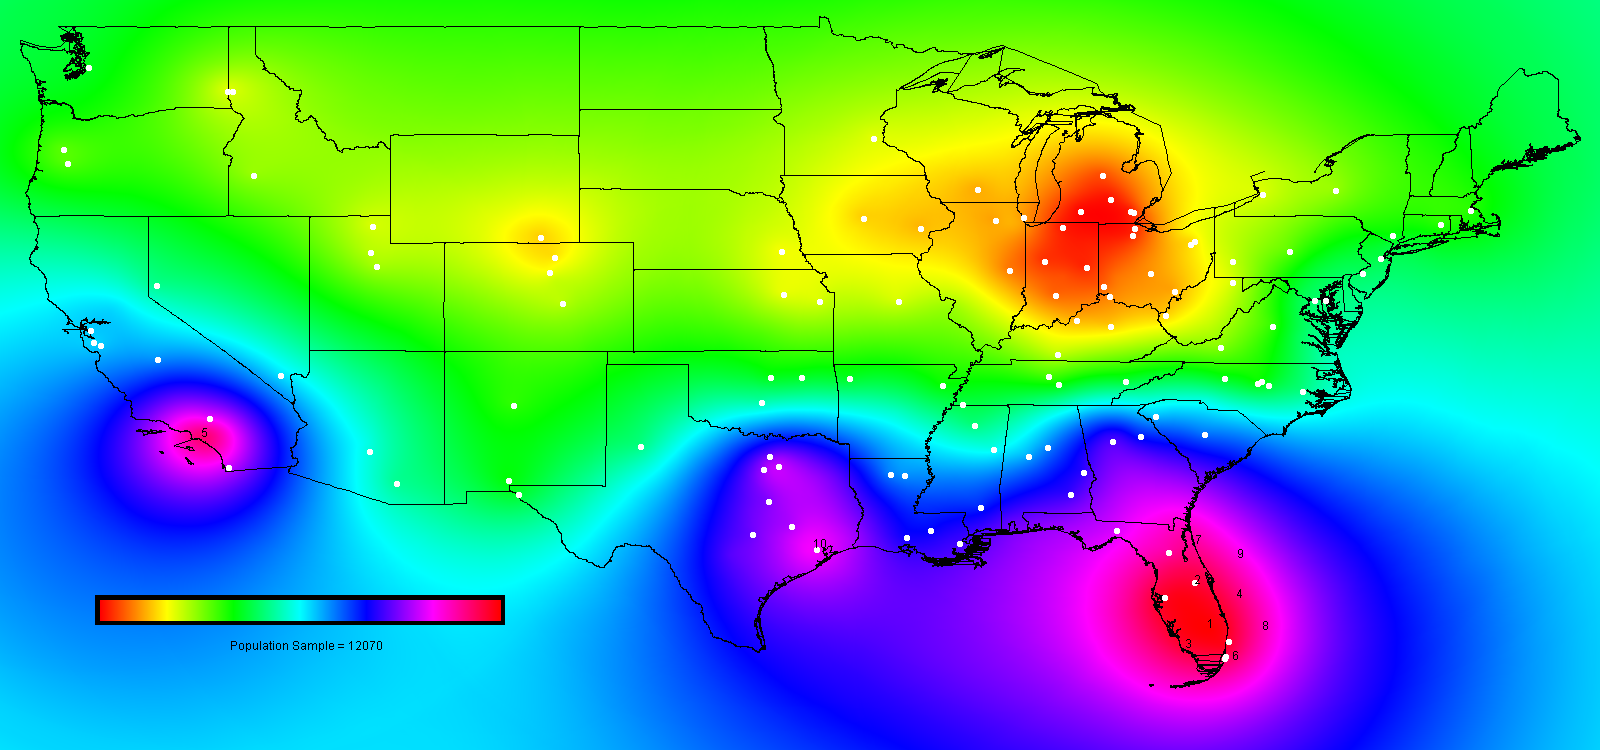
Once the role of competing schools is accounted for (Figure 2) Florida dominates (with some overflow into Georgia)--amazingly Florida schools sweep the top seven spots! Unlike in Case 2 when the midwest shoots to the bottom of the list all by itself, when the top recruits are considered the bottom of the rankings is a mix of midwest and western schools. The northern states west of Ohio are noticably less-populated than the rest of the country (and relative to the map with all of the recruits). The prominence of Florida relative to everywhere else is what really sticks out, however, as seen in Figure 4 below which compares the map for all players versus merely the most highly recruited players.
| Pre-Subtraction | Post-Subtraction | |||||
| Rank | School | Effective Pop. | Rank | School | Effective Pop. | |
| 1 | Georgia Tech | 260 | 1 | South Florida | 79 | |
| 2 | Georgia | 254 | 2 | UCF | 78 | |
| 3 | Auburn | 253 | 3 | Florida Atlantic | 76 | |
| 4 | UAB | 250 | 4 | Florida | 74 | |
| 5 | Clemson | 248 | 5 | FIU | 74 | |
| 6 | Alabama | 245 | 6 | Florida State | 73 | |
| 7 | Troy | 244 | 7 | Miami | 73 | |
| 8 | Tennessee | 239 | 8 | Auburn | 60 | |
| 9 | South Carolina | 238 | 9 | Troy | 60 | |
| 10 | Mississippi State | 236 | 10 | Georgia Tech | 60 | |
| 11 | Florida State | 236 | 11 | Georgia | 56 | |
| 12 | Middle Tennessee | 235 | 12 | South Carolina | 54 | |
| 13 | Vanderbilt | 231 | 13 | Tulane | 50 | |
| 14 | Ole Miss | 230 | 14 | Southern Miss | 49 | |
| 15 | Wake Forest | 227 | 15 | Clemson | 47 | |
| 16 | Southern Miss | 227 | 16 | UAB | 47 | |
| 17 | Western Kentucky | 225 | 17 | LSU | 46 | |
| 18 | Memphis | 224 | 18 | Louisiana-Lafayette | 45 | |
| 19 | Kentucky | 223 | 19 | Alabama | 44 | |
| 20 | Florida | 223 | 20 | Houston | 42 | |
| 21 | Virginia Tech | 222 | 21 | Rice | 42 | |
| 22 | Marshall | 221 | 22 | Louisiana-Monroe | 38 | |
| 23 | Cincinnati | 220 | 23 | SMU | 37 | |
| 24 | Louisiana-Monroe | 220 | 24 | Texas A&M | 37 | |
| 25 | Louisville | 219 | 25 | Louisiana Tech | 37 | |
| 26 | North Carolina | 218 | 26 | Mississippi State | 36 | |
| 27 | Duke | 217 | 27 | Baylor | 33 | |
| 28 | Louisiana Tech | 217 | 28 | TCU | 33 | |
| 29 | Ohio | 217 | 29 | ECU | 31 | |
| 30 | Miami University | 217 | 30 | North Texas | 31 | |
| 31 | Ohio State | 215 | 31 | Wake Forest | 30 | |
| 32 | NC State | 214 | 32 | NC State | 30 | |
| 33 | LSU | 213 | 33 | North Carolina | 30 | |
| 34 | UCF | 213 | 34 | Texas | 29 | |
| 35 | Arkansas State | 213 | 35 | Duke | 29 | |
| 36 | Tulane | 212 | 36 | Maryland | 28 | |
| 37 | South Florida | 212 | 37 | UCLA | 28 | |
| 38 | Virginia | 211 | 38 | USC | 28 | |
| 39 | West Virginia | 210 | 39 | Navy | 28 | |
| 40 | Indiana | 210 | 40 | Ole Miss | 28 | |
| 41 | Ball State | 208 | 41 | Tennessee | 26 | |
| 42 | Pittsburgh | 206 | 42 | San Diego State | 26 | |
| 43 | Louisiana-Lafayette | 206 | 43 | Virginia | 23 | |
| 44 | Akron | 204 | 44 | Temple | 23 | |
| 45 | SMU | 203 | 45 | Memphis | 20 | |
| 46 | Kent State | 203 | 46 | Virginia Tech | 20 | |
| 47 | Maryland | 202 | 47 | Middle Tennessee | 19 | |
| 48 | Bowling Green | 200 | 48 | Rutgers | 18 | |
| 49 | ECU | 199 | 49 | Vanderbilt | 14 | |
| 50 | Purdue | 198 | 50 | Penn State | 14 | |
| 51 | Toledo | 197 | 51 | Arkansas State | 13 | |
| 52 | Navy | 197 | 52 | Army | 11 | |
| 53 | North Texas | 195 | 53 | West Virginia | 11 | |
| 54 | TCU | 194 | 54 | Pittsburgh | 10 | |
| 55 | Illinois | 194 | 55 | Oklahoma | 9 | |
| 56 | Arkansas | 191 | 56 | Arkansas | 9 | |
| 57 | Houston | 190 | 57 | Western Kentucky | 6 | |
| 58 | Rice | 190 | 58 | Connecticut | 5 | |
| 59 | Texas A&M | 189 | 59 | Tulsa | 5 | |
| 60 | Eastern Michigan | 189 | 60 | Marshall | 4 | |
| 61 | Notre Dame | 189 | 61 | Fresno State | 3 | |
| 62 | Michigan | 188 | 62 | Boston College | 2 | |
| 63 | Penn State | 188 | 63 | UNLV | 2 | |
| 64 | Baylor | 188 | 64 | Arizona State | 2 | |
| 65 | Florida Atlantic | 187 | 65 | Oklahoma State | 2 | |
| 66 | Western Michigan | 183 | 66 | Syracuse | 2 | |
| 67 | FIU | 181 | 67 | Texas Tech | 1 | |
| 68 | Miami | 179 | 68 | Ohio | 1 | |
| 69 | Tulsa | 179 | 69 | Kent State | 0 | |
| 70 | Michigan State | 179 | 70 | Kentucky | 0 | |
| 71 | Northwestern | 179 | 71 | Hawaii | 0 | |
| 72 | Missouri | 178 | 72 | Akron | 0 | |
| 73 | Temple | 177 | 73 | Arizona | 0 | |
| 74 | Oklahoma | 174 | 74 | Buffalo | -1 | |
| 75 | Northern Illinois | 173 | 75 | Louisville | -4 | |
| 76 | Texas | 170 | 76 | Ohio State | -4 | |
| 77 | Oklahoma State | 169 | 77 | San Jose State | -4 | |
| 78 | Rutgers | 165 | 78 | Stanford | -5 | |
| 79 | Central Michigan | 163 | 79 | UTEP | -5 | |
| 80 | Buffalo | 160 | 80 | California | -5 | |
| 81 | Kansas | 159 | 81 | Cincinnati | -6 | |
| 82 | Iowa | 157 | 82 | New Mexico State | -6 | |
| 83 | Wisconsin | 154 | 83 | Missouri | -7 | |
| 84 | Army | 150 | 84 | Miami University | -9 | |
| 85 | Kansas State | 147 | 85 | Nevada | -10 | |
| 86 | Syracuse | 143 | 86 | Indiana | -10 | |
| 87 | Iowa State | 141 | 87 | New Mexico | -11 | |
| 88 | Nebraska | 134 | 88 | Washington | -12 | |
| 89 | Texas Tech | 130 | 89 | Kansas | -12 | |
| 90 | Connecticut | 125 | 90 | Bowling Green | -13 | |
| 91 | Minnesota | 115 | 91 | Toledo | -13 | |
| 92 | UCLA | 114 | 92 | Illinois | -14 | |
| 93 | USC | 114 | 93 | Ball State | -14 | |
| 94 | Boston College | 110 | 94 | Eastern Michigan | -14 | |
| 95 | San Diego State | 105 | 95 | Michigan | -15 | |
| 96 | Air Force | 103 | 96 | Kansas State | -15 | |
| 97 | New Mexico | 102 | 97 | Central Michigan | -16 | |
| 98 | UTEP | 100 | 98 | Oregon State | -16 | |
| 99 | New Mexico State | 100 | 99 | Purdue | -16 | |
| 100 | Colorado | 97 | 100 | Minnesota | -16 | |
| 101 | Arizona State | 95 | 101 | Oregon | -17 | |
| 102 | Colorado State | 94 | 102 | Northwestern | -17 | |
| 103 | UNLV | 93 | 103 | Michigan State | -17 | |
| 104 | Arizona | 91 | 104 | Nebraska | -17 | |
| 105 | Wyoming | 88 | 105 | Northern Illinois | -18 | |
| 106 | Fresno State | 87 | 106 | Iowa | -18 | |
| 107 | BYU | 80 | 107 | Air Force | -18 | |
| 108 | Utah | 78 | 108 | Wisconsin | -19 | |
| 109 | San Jose State | 76 | 109 | Notre Dame | -19 | |
| 110 | Stanford | 75 | 110 | Iowa State | -19 | |
| 111 | California | 73 | 111 | Western Michigan | -19 | |
| 112 | Utah State | 73 | 112 | BYU | -21 | |
| 113 | Nevada | 71 | 113 | Boise State | -21 | |
| 114 | Boise State | 59 | 114 | Utah | -22 | |
| 115 | Oregon | 50 | 115 | Washington State | -22 | |
| 116 | Oregon State | 49 | 116 | Colorado | -22 | |
| 117 | Idaho | 49 | 117 | Idaho | -23 | |
| 118 | Washington State | 49 | 118 | Utah State | -23 | |
| 119 | Washington | 45 | 119 | Colorado State | -24 | |
| 120 | Hawaii | 0 | 120 | Wyoming | -25 |
Added 12/03/2009